Table of Contents
Phillips Curve
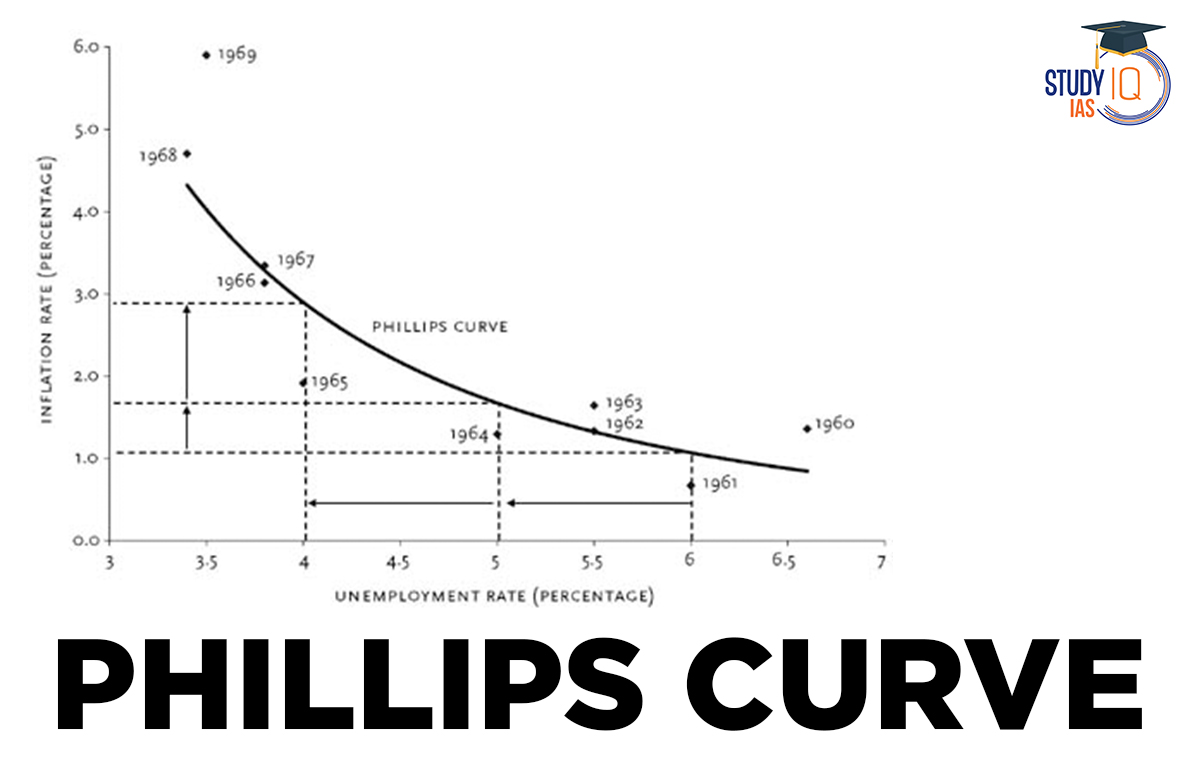
The Phillips curve is a macroeconomic concept that describes the inverse relationship between unemployment and inflation. It is named after the economist A.W. Phillips who first described the relationship in an academic paper published in 1958. Phillips analyzed data from the United Kingdom and found that there was an inverse relationship between the Rate of Unemployment and the rate of wage Inflation.
Read More: Types of Inflation
Phillips Curve in Economics
The Phillips Curve became a widely studied and debated topic in macroeconomics and was seen as a tool for policymakers to manage the economy by trading off between inflation and unemployment. However, the relationship between inflation and unemployment has become less clear over time, and the Phillips curve has come under criticism for oversimplifying the complexity of the relationship between these two variables.
Read More: Basel Norms
Phillips Curve Equation
The Phillips Curve represents the inverse relationship between unemployment and inflation. The basic equation of the Phillips curve is:
Unemployment Rate = Natural Rate of Unemployment – (Coefficient of Inflation x Inflation rate)
In simpler terms, the equation suggests that when the rate of inflation increases, there will be a decrease in the rate of unemployment. Conversely, when the rate of inflation decreases, there will be an increase in the rate of unemployment.
The natural rate of unemployment refers to the level of unemployment that exists in the economy even when it is operating at full capacity, which is determined by structural factors such as demographics, education, and technology. The coefficient of inflation reflects the sensitivity of the unemployment rate to changes in inflation. The Phillips curve provides a framework for policymakers to balance inflation and unemployment, but its accuracy has been questioned over time.
Read More: Commercial Banks
Phillips Curve Graph
Here is a Diagram of the Phillips Curve for a better understanding:
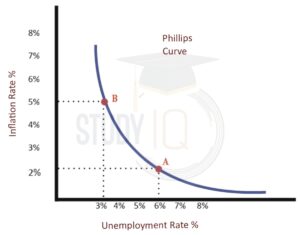
Read about: Finance Ministers of India List
Phillips Curve Significance
The Phillips curve has been an important concept in macroeconomics and has several implications for policymakers. Here are some key points about the importance of the Phillips curve:
Relationship Between Inflation and Unemployment
The Phillips curve suggests that there is a trade-off between inflation and unemployment, as higher levels of inflation lead to lower levels of unemployment, and vice versa. This relationship can help policymakers set appropriate targets for inflation and unemployment.
Policymakers Make Decisions on Monetary Policy
By understanding the relationship between inflation and unemployment, policymakers can make decisions on Monetary Policy that aim to achieve desired levels of inflation and unemployment. For example, they may decide to raise or lower interest rates to control inflation or stimulate the economy.
Predict Future Inflation and Unemployment Rates
The Phillips curve can be used to make predictions about future inflation and unemployment rates based on historical data. This can help policymakers anticipate future economic trends and take appropriate actions to manage the economy.
Analyze Changes in the Labour Market
The Phillips curve can help policymakers understand changes in the labour market, such as changes in wages and productivity, and how these changes affect inflation and unemployment.
Important Implications for International Trade and Exchange Rates
The Phillips curve can be used to analyze the impact of inflation and unemployment on international trade and exchange rates. For example, if a country experiences high inflation, it may experience a decrease in demand for its exports, leading to a decrease in its exchange rate.
Read about: GDP of Indian States
Phillips Curve UPSC
The Phillips curve is an important concept in macroeconomics and is included in the UPSC Syllabus for both the Preliminary and Mains exams. Understanding the Phillips curve and its implications is important for aspirants preparing for the UPSC exam, as it is a key concept in economic policy-making. UPSC Online Coaching and UPSC Mock Test can help aspirants practice questions related to the Phillips curve and its applications, and enhance their understanding of this topic.
Read about: Purchasing Power Parity
 Foreign Contribution Regulation Act (FCR...
 What Are Forex Reserves? Components, Sig...
 Ramsar Convention 1971 Explained: Meanin...