Table of Contents
Unemployment is one of the most crucial indicators of a country’s economic health. In India, the unemployment rate reflects not only the availability of jobs but also the participation of the workforce in different sectors. According to the latest Periodic Labour Force Survey (PLFS) released by the Ministry of Statistics and Programme Implementation (MoSPI), India’s unemployment rate declined to 5.2% in July 2025, down from 5.6% in June 2025. This decline highlights a positive trend in the country’s employment scenario and is seen as a sign of recovery in both rural and urban job markets.
Current Unemployment Rate in India (July 2025)
-
Unemployment Rate: 5.2% (July 2025) vs. 5.6% (June 2025).
-
Labour Force Participation Rate (LFPR): 54.9% in July 2025 compared to 54.2% in June 2025.
-
Rural LFPR: 56.9%
-
Urban LFPR: 50.7%
-
-
Worker Population Ratio (WPR):
-
Rural: 54.4%
-
Urban: 47.0%
-
-
Gender Gap in Workforce:
-
Rural Male LFPR: 78.1%
-
Urban Male LFPR: 75.1%
-
Rural Female LFPR: 36.9% (up from 35.2% in June)
-
Urban Female LFPR: 23.5%
-
This data shows that rural India continues to outperform urban India in terms of workforce participation, with a notable increase in rural female participation.
India’s Unemployment Rate at 5.1% in April 2025
According to the first monthly bulletin of the Periodic Labour Force Survey (PLFS), India’s unemployment rate stood at 5.1% in April 2025 for individuals aged 15 years and above. Rural unemployment was recorded at 4.5%, while urban joblessness was higher at 6.5%. Among males, the rate was 5.2%, and for females, it was 5%. Youth unemployment (15-29 years) reached 13.8%. The Labour Force Participation Rate (LFPR) was 55.6% overall. The PLFS bulletin, introduced in January 2025, provides timely labor data to aid policymaking and track employment trends across the country.
Periodic Labour Force Survey (PLFS) 2023-24 Data
- Kerala: Kerala had one of the highest youth unemployment rates in the 15-29 age group at 29.9%, with an alarming 47.1% among females and 19.3% among males.
- Madhya Pradesh: Recorded the lowest youth unemployment rate at 3.2%, followed closely by Gujarat.
- Union Territories: Lakshadweep reported the highest youth unemployment rate at 36.2%, with female joblessness soaring to 79.7%. Andaman & Nicobar Islands also had a high rate of 33.6%.
- Urban vs. Rural: In urban areas, the youth unemployment rate stood at 14.7%, significantly higher than the rural rate of 8.5%. Female unemployment was notably higher in urban areas at 20.1%, compared to 8.2% in rural areas.
Current Unemployment Rate in India 2024
As per the latest data from the Centre for Monitoring Indian Economy (CMIE), India’s unemployment rate stood at 9.2% in June 2024, marking a sharp increase from 7% in May 2024. This rise reflects several economic factors, including inflationary pressures, rural economic challenges, and job market mismatches.
Additionally, the Labour Participation Rate (LPR) in India rose to 41.4% in June 2024, compared to 40.8% in May 2024 and 39.9% in June 2023. The LPR, which measures the proportion of working-age people actively engaged in the labor market, showed slight improvement but was still below the level needed to support robust economic growth.
What is the Unemployment Rate?
Key Highlights of RBI’s Data
Increase in Employment Numbers
- Employment in India increased by 4.67 crore, reaching a provisional total of 64.33 crore in the fiscal year 2023-24, up from 59.67 crore in 2022-23.
- The number of employed individuals was 57.75 crore in 2022-23, steadily rising from 56.56 crore in 2021-22.
Decline in Unemployment Rate
- The unemployment rate in urban areas for individuals aged 15 years and above decreased from 6.8% in the January-March quarter of 2023 to 6.7% in the same quarter of 2024.
- There was a drop in the female unemployment rate from 9.2% in January-March 2023 to 8.5% in January-March 2024.
Increasing Labour Force Participation
- The Labour Force Participation Rate (LFPR) in urban areas for those aged 15 years and above rose from 48.5% in January-March 2023 to 50.2% in January-March 2024.
- This rise indicates an increasing proportion of the working-age population engaging in the labour market.
Rising Worker Population Ratio
- The Worker Population Ratio (WPR) for individuals aged 15 years and above increased from 45.2% in January-March 2023 to 46.9% in January-March 2024.
- The female Worker Population Ratio in urban areas rose from 20.6% in January-March 2023 to 23.4% in January-March 2024, indicating enhanced labour market participation among women.
Gender-Specific Unemployment Rates
The disparity in unemployment rates between genders is also noteworthy. In June 2024, female unemployment reached 18.5%, significantly higher than the national average and an increase from 15.1% in June 2023. Meanwhile, male unemployment was recorded at 7.8%, only slightly up from 7.7% in the same period last year.
Labour Participation Rate (LPR)
The Labour Participation Rate (LPR), which includes individuals working or actively looking for a job among the total working-age population, rose to 41.4% in June 2024 from 40.8% in May 2024 and 39.9% in June 2023. Despite the increase in LPR, the unemployment rates, especially in rural areas (9.3% in June 2024 from 6.3% in May 2024) and urban areas (8.9% in June 2024 from 8.6% in May 2024), reflect underlying economic challenges.
Current Unemployment Rate in India
| Year | Unemployment Rate (percent) |
|---|---|
| 2024 | 6.57 (January 2024) |
| 2023 | 8.03 |
| 2022 | 7.33 |
| 2021 | 5.98 |
| 2020 | 8.00 |
| 2019 | 5.27 |
| 2018 | 5.33 |
| 2017 | 5.36 |
| 2016 | 5.42 |
| 2015 | 5.44 |
| 2014 | 5.44 |
| 2013 | 5.42 |
| 2012 | 5.41 |
| 2011 | 5.43 |
| 2010 | 5.55 |
| 2009 | 5.54 |
| 2008 | 5.41 |
Unemployment in Indian States
- Goa has the highest unemployment rate at nearly 10%, over three times the national average of 3.17%.
- Four of the top five states with the highest unemployment rates (Goa, Kerala, Haryana, and Punjab) are among the richer states, whereas Maharashtra and Gujarat, also rich states, have lower unemployment rates below the national average.
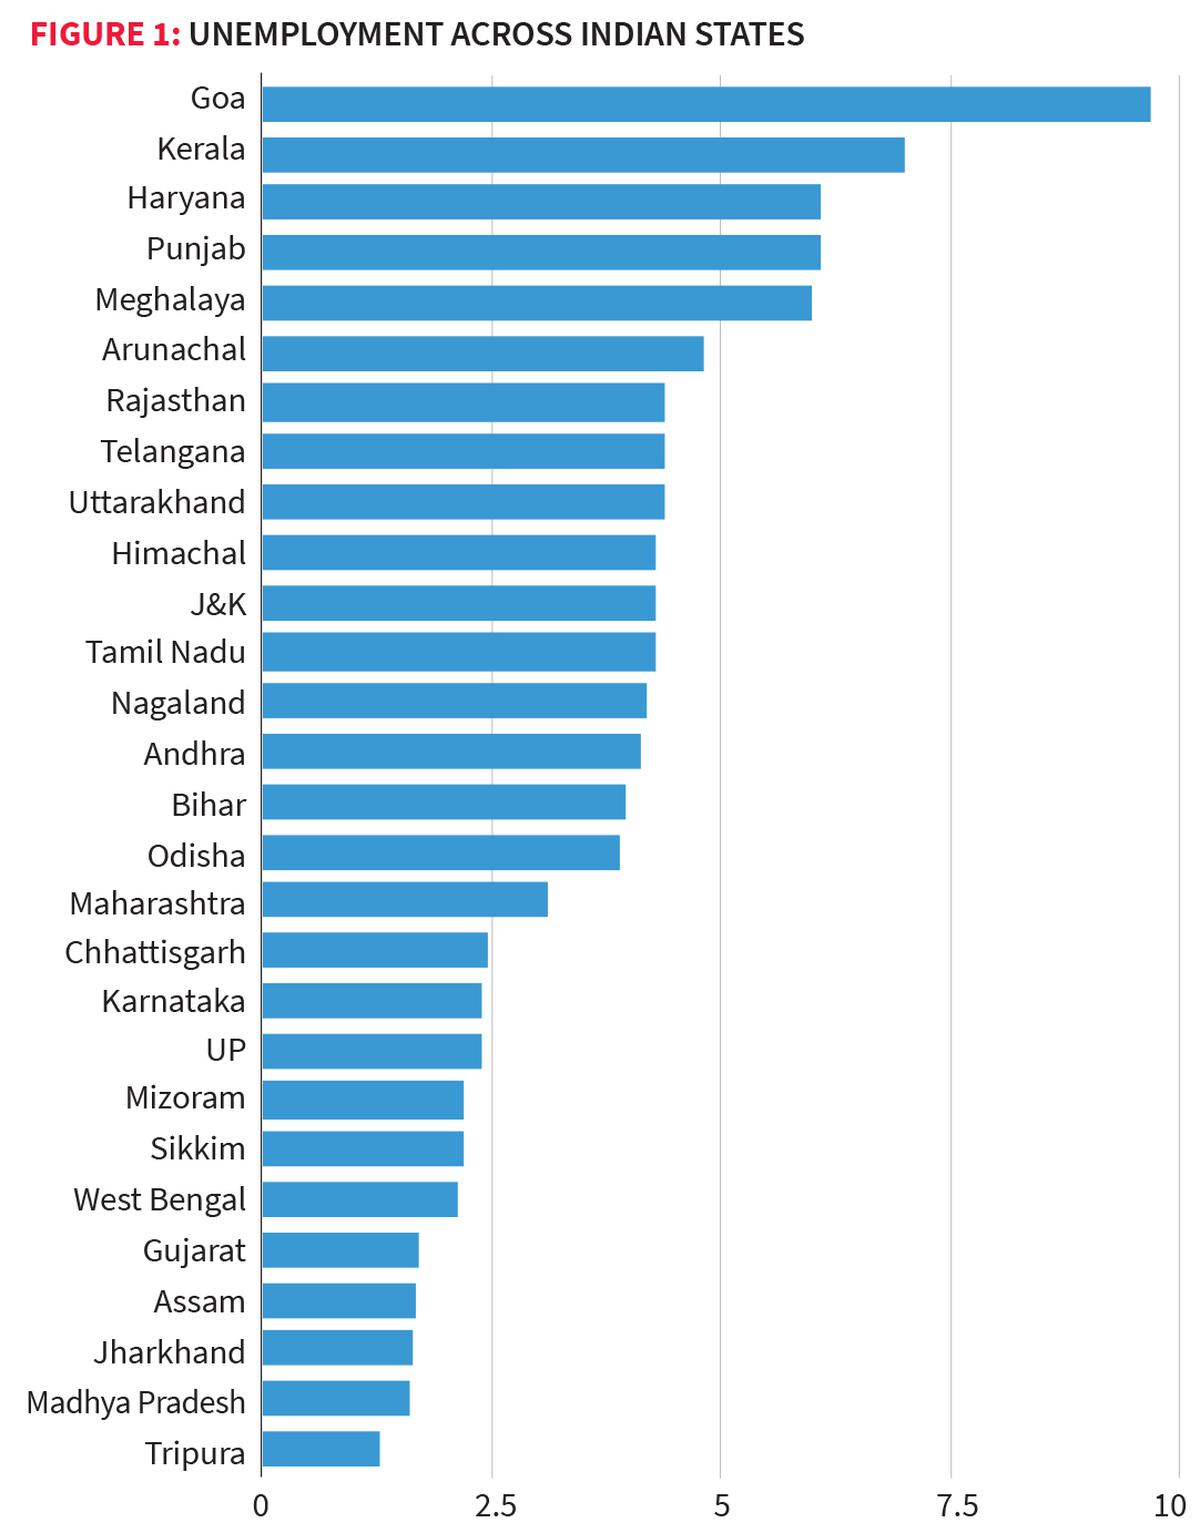
- All northern states (Jammu and Kashmir, Punjab, Haryana, Uttarakhand, Himachal Pradesh) and southern states, except Karnataka, reported higher-than-average unemployment rates.
- Twelve out of 27 states studied have unemployment rates below the national average, with large states like Maharashtra (3%), Uttar Pradesh (2.4%), and Madhya Pradesh (1.6%) contributing to lowering the national average.
| Important Fact |
| The analysis focuses on unemployment among individuals aged 15 and above across major Indian States (excluding Union Territories and Manipur due to incomplete fieldwork) using data from the 2022-23 Periodic Labour Force Survey (PLFS). |
Unemployment Rate in India State-wise 2023
Center for Monitoring Indian Economy (CMIE) reported an increase in India’s unemployment rate to 8.30%, marking the highest level in 16 months, up from 8.00% in November. CMIE data also indicated that the urban unemployment rate climbed to 10.09% in December, compared to 8.96% in November, while the rural areas saw a slight decline from 7.55% to 7.44%.
For the year 2022, Haryana recorded the highest state unemployment rate at 37.4%, while Odisha had the lowest rate at 0.9%. The CMIE statistics released on March 1, 2023, provide a comprehensive breakdown of unemployment across different states in India for December 2022, shedding light on the varying employment challenges faced by these regions.
| Unemployment rate in India State-wise 2023 | |
| State | % of Unemployment Rate in India |
| Haryana | 37.4 |
| Rajasthan | 28.5 |
| Bihar | 19.1 |
| Jharkhand | 18 |
| Jammu and Kashmir | 14.8 |
| Tripura | 14.3 |
| Sikkim | 13.6 |
| Goa | 9.9 |
| Andhra Pradesh | 7.7 |
| Himachal Pradesh | 7.6 |
| Assam | 4.7 |
| Haryana | 3.74 |
| Chhattisgarh | 3.4 |
| Madhya Pradesh | 3.2 |
| Maharashtra | 3.1 |
| Karnataka | 2.5 |
| Gujrat | 2.3 |
| Odisha | 0.9 |
Statewise List of Unemployment Rate of India 2022
Here is the list of the Statewise and Monthwise as per the CMIE Report:
| STATE | JAN 2022 | FEB 2022 | MAR 2022 | APR 2022 | MAY 2022 | JUN 2022 | JUL 2022 | AUG 2022 | SEP 2022 | Oct 2022 | Nov 2022 |
| Andhra Pradesh | 6.2 | 7.1 | 9.2 | 5.3 | 4.4 | 4.5 | 5.8 | 6 | 4.8 | 5.4 | 9.0 |
| Assam | 8.5 | 10.2 | 7.7 | 1.2 | 8.2 | 17.2 | 3.7 | NA | 0.4 | 8.1 | 13.2 |
| Bihar | 13.3 | 13.9 | 14.4 | 21.1 | 13.3 | 14 | 18.8 | 12.8 | 11.4 | 15.0 | 17.3 |
| Chhattisgarh | 3 | 1.7 | 0.6 | 0.6 | 0.8 | 1.2 | 0.8 | 0.4 | 0.1 | 0.9 | 0.1 |
| Delhi | 14.1 | 9.3 | 8.9 | 11.2 | 13.6 | 10.2 | 8.9 | 8.2 | 9.6 | 6.7 | 12.6 |
| Goa | 11.6 | 12 | 12.7 | 15.5 | 13.4 | 5.5 | 13.7 | 13.7 | 10.9 | NA | 13.6 |
| Gujarat | 1.2 | 2.5 | 1.8 | 1.6 | 2.1 | 3 | 2.2 | 2.6 | 1.6 | 1.7 | 2.5 |
| Haryana | 23.4 | 30.9 | 26.5 | 34.5 | 24.6 | 30.5 | 26.9 | 37.3 | 22.9 | 31.7 | 30.6 |
| Himachal Pradesh | 13.8 | 11.8 | 11.7 | 0.2 | 9.6 | 10.7 | 6.3 | 7.3 | 8.6 | 9.7 | 8.8 |
| Jammu & Kashmir | 15.2 | 13.2 | 25 | 15.6 | 18.3 | 17.2 | 20.2 | 32.8 | 23.2 | 22.6 | 22.4 |
| Jharkhand | 8.9 | 15 | 14.5 | 14.2 | 13.1 | 12.1 | 14 | 17.3 | 12.2 | 17.1 | 14.3 |
| Karnataka | 2.9 | 2 | 1.8 | 2.7 | 4.3 | 3.7 | 3.5 | 3.5 | 3.7 | 2.8 | 1.8 |
| Kerala | 5 | 5 | 6.7 | 5.8 | 5.8 | 5.3 | 4.9 | 6.1 | 6.4 | 4.8 | 5.9 |
| Madhya Pradesh | 3 | 2.8 | 1.6 | 1.6 | 1.7 | 0.5 | 1.9 | 2.6 | 0.8 | 0.8 | 6.9 |
| Maharashtra | 4.2 | 4.3 | 4 | 3.1 | 4.2 | 4.8 | 3.7 | 2.2 | 4 | 4.3 | 3.6 |
| Meghalaya | 1.5 | 1.4 | 2 | 2.2 | 4.1 | 2.3 | 1.5 | 2 | 2.3 | 3.5 | 2.3 |
| Odisha | 1.8 | 1 | 9.7 | 1.5 | 2.6 | 1.2 | 0.9 | 2.6 | 2.9 | 1.1 | 1.6 |
| Puducherry | 7.8 | 3.7 | 4.2 | 5.6 | 5.6 | 0.8 | 2.8 | 5.2 | 3.9 | 2.6 | 2.9 |
| Punjab | 9.3 | 9 | 6.9 | 7.2 | 9.2 | 8.5 | 7.7 | 7.4 | 7.2 | 9.1 | 7.8 |
| Rajasthan | 18.9 | 32.4 | 24.5 | 28.8 | 22.2 | 29.9 | 19.6 | 31.4 | 23.9 | 31.3 | 25.0 |
| Sikkim | NA | NA | NA | 8.7 | 7.5 | 12.7 | 6.5 | NA | NA | 3.9 | 5.7 |
| Tamil Nadu | 5.3 | 3.2 | 4.1 | 3.2 | 3.1 | 2.1 | 3 | 7.2 | 4.1 | 3.0 | 3.8 |
| Telangana | 0.7 | 12.9 | 6.5 | 9.9 | 9.4 | 10 | 5.8 | 6.9 | 8.6 | 8.8 | 6.0 |
| Tripura | 17.1 | 9.8 | 14.1 | 14.6 | 17.4 | 9.4 | 13 | 16.3 | 17 | 10.6 | 14.4 |
| Uttar Pradesh | 3 | 2.7 | 4.4 | 2.9 | 3.1 | 2.8 | 3.3 | 3.9 | 4 | 4.1 | 4.1 |
| Uttarakhand | 3.5 | 4.6 | 3.5 | 5.3 | 2.9 | 8.7 | NA | NA | 0.5 | 3.3 | 1.2 |
| West Bengal | 6.4 | 6.3 | 5.6 | 6.2 | 5.8 | 5.2 | 6.3 | 7.4 | 3.3 | 5.8 | 5.4 |
| India | 6.6 | 8.1 | 7.6 | 7.8 | 7.1 | 7.8 | 6.8 | 8.3 | 6.4 | 7.9 | 8.0 |
Trend of Last 10 Year Unemployment Rate in India
In India, the issue of unemployment is still a major one, with variations seen across various areas and industries. The latest Bloomberg study cites data from the Centre for Monitoring Indian Economy (CMIE) for September and states that as of September 2023, the country’s overall jobless rate will be 7.95 per cent. The Trends of the Last 10 Years’ Unemployment Rate in India have been mentioned in the table below:
| Trend of Last 10-Year Unemployment Rate in India | ||
|---|---|---|
| S.No | Year | Unemployment Rate in % |
| 1 | 2023 | 10.05 (as of Oct) |
| 2 | 2022 | 7.33 |
| 3 | 2021 | 5.98 |
| 4 | 2020 | 8.00 |
| 5 | 2019 | 5.27 |
| 6 | 2018 | 5.33 |
| 7 | 2017 | 5.36 |
| 8 | 2016 | 5.42 |
| 9 | 2015 | 5.44 |
| 10 | 2014 | 5.44 |
Highest Unemployment Rate in India
Since January 2022, the employment rate has grown, reaching a record high of 37.1% in December 2022. With 28.5% in Rajasthan, 20.8% in Delhi, and 37.4% in Haryana, the unemployment rate increased in December 2022, as per the CMIE recent Report.
Unemployment Rate Calculator
The percentage of persons without a job is known as the unemployment rate. The percentage is used to indicate this rate. The unemployment rate fluctuates according to the state of the economy. The employment rate will rise if the economy is struggling and there are fewer jobs available. Similarly, it is predicted that the unemployment rate will decrease when a nation’s economy is strong, growing, and offering the general populace a wide variety of job opportunities.
Unemployment Rate = Unemployed / Civilian Labor Force
Or
Unemployment Rate = No. of Unemployed Persons / (No. of Employed Persons + No. of Unemployed Persons)
Causes of Unemployment in India
In every nation, there are a variety of reasons that contribute to unemployment. Whether unemployment is brought on by a drop in the labour force or a lack of jobs determines whether it will be temporary or permanent. The main causes of unemployment in India are four different forms of unemployment.
These four categories of unemployment include structural, frictional, seasonal, and cyclical. Through expansionary monetary policy, we may combat seasonal and cyclical unemployment by raising public spending when times are tough. A few main causes of unemployment are:
- A sizable population
- The working population’s poor educational attainment or lack of vocational skills.
- Labour-intensive industries are experiencing a downturn in private investment, especially following the demonetization.
- Transitioning between the three sectors is challenging due to the poor productivity in the agriculture sector and the dearth of alternatives for agricultural employees.
- Legal difficulties, insufficient government backing, and weak market, financial, and infrastructure ties to small firms render those operations unprofitable due to the cost and compliance overruns.
- Low investments in the manufacturing sector and inadequate infrastructural development limit secondary sector job opportunities.
The government can build up a public employment program that produces full-time employment at minimum pay levels to create job stability, or it can provide temporary labour to unemployed individuals as part of the food-for-work program. Stabilizing market forces and lowering the trend toward structural changes or the necessity to fire people due to a lack of market demand will lessen the cyclical type of unemployment.
Determinants of Unemployment
- A negative correlation exists between self-employment share in the labour force and unemployment rates, suggesting states with higher self-employment, often informal, have lower unemployment rates.
- The causal relationship between high unemployment and the lack or reluctance for self-employment remains unclear.
Impact of Urbanization and Agriculture
- A positive relationship is observed between urbanisation (urban share of the labour force) and unemployment rates.
- Highly urbanised states like Goa and Kerala show high unemployment, whereas states with large rural sectors like Uttar Pradesh, Jharkhand, and Madhya Pradesh have lower unemployment rates.
Education and Employment
- There’s a positive correlation between the proportion of graduates in the labour force and unemployment rates.
- States with higher education levels, like Kerala, have higher unemployment, while states with lower graduate percentages, like Gujarat and Maharashtra, have lower unemployment rates.
- The disparity may be due to graduates seeking higher-wage jobs, mismatched skills, or insufficient modern sector growth to absorb new graduates.
Additional Factors
State policies also significantly influence unemployment rates.
 Index of Service Production (ISP): Need,...
 Rise of Orange Economy in India: Key Sec...
 Payments Bank Regulation – Paytm Payme...