Home   »   Air Pollution Cuts Life Expectancy

Air Pollution Cuts Life Expectancy

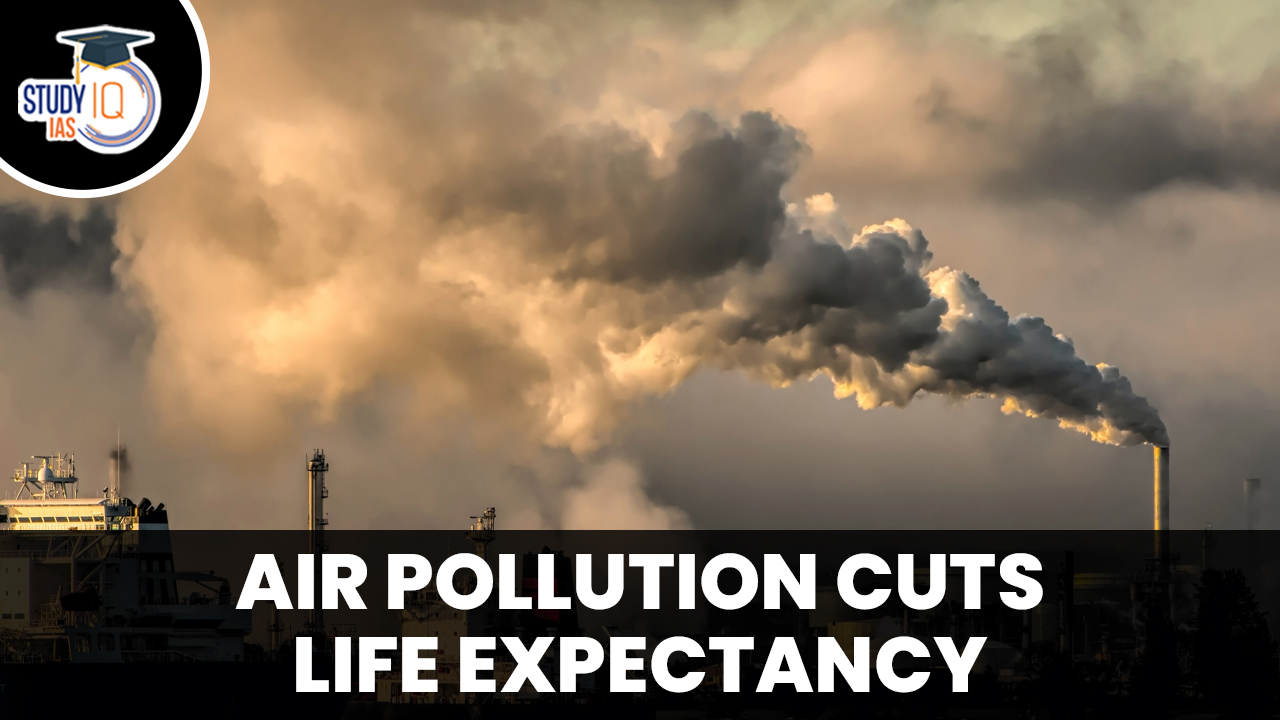
Context:  According to the report ‘Air Quality Life Index (AQLI) Annual Update 2023’ by the University of Chicago’s Energy Policy Institute, poor air quality takes 5.3 years off the life of a person in India.

Key Highlights of the Report

  • Air pollution and the South Asia:
    • South Asia is home to the most polluted countries of Bangladesh, India, Nepal, and Pakistan, accounts for more than half of the total life years lost globally due to high pollution.
    • Bangladesh remains the most polluted country in the world.
    • The average person living in Bangladesh, India, Nepal, and Pakistan is exposed to particulate pollution levels that are 51.3% higher than at the turn of the century.
    • Air pollution is reducing the life span of people living in South Asia by 5.1 years, according to the report.
  • Reasons behind the spike in air pollution: The uptick in air pollution in South Asia is an outcome of rapid industrialization, economic development, and population growth, which increased energy demand and fossil fuel use across the region.
    • In India and Pakistan, the number of vehicles on the road has increased about four-fold since the early 2000s. The number of vehicles roughly tripled in Bangladesh from 2010 to 2020.
    • Electricity production using fossil fuels tripled between 1998 and 2017 in Bangladesh, India, Nepal and Pakistan combined.
  • Air Pollution and India:
    • In India, the second most polluted nation, all 1.3 billion people live in areas where the annual average particulate pollution level surpasses the WHO guideline.
    • In India, on average, poor air quality takes 5.3 years off the life of a person, the report added.
      • In contrast, cardiovascular diseases decrease the average Indian’s life expectancy by around 4.5 years, while child and maternal malnutrition reduce life expectancy by 1.8 years.
    • The report said from 1998 to 2021, average annual particulate pollution increased by 67.7%, further reducing average life expectancy by 2.3 years.
    • Between 2020 and 2021, PM2.5 level in India increased from 56.2 µg/m3 to 58.7 µg/m3, which is 10 times more than the WHO guideline.
    • The most polluted region of the country is “the Northern Plains, where more than a half billion people live”.
    • Notably, Delhi’s annual average PM2.5 level in 2021 was found to be 126.5 µg/m3 and the life expectancy of an average person living in the city has shortened by 11.9 years.
    • A 2022 study, published in the journal Lancet, found that air pollution caused more than 16.7 lakh premature deaths in India in 2019.
      • Out of the total deaths, 9.8 lakh were caused by PM2.5 pollution, and another 6.1 lakh by household air pollution.

Various Initiatives undertaken by Government for mitigation of Air Pollution

National Clean Air Programme (NCAP)
  • It was launched by the Ministry of Environment, Forests and Climate Change (MoEFCC) in January 2019.
  • It is the first-ever effort in the country to frame a national framework for air quality management with a time-bound reduction target.
  • It seeks to cut the concentration of coarse (particulate matter of diameter 10 micrometer or less, or PM10) and fine particles (particulate matter of diameter 2.5 micrometer or less, or PM2.5) by at least 20% in the next five years, with 2017 as the base year for comparison.
    • A new updated target of 40% reduction in particulate matter concentration in cities covered under the (NCAP) by 2026 has been set.
  • It covers 132 non-attainment cities which were identified by the Central Pollution Control Board (CPCB).
    • Non-attainment cities are those that have fallen short of the National Ambient Air Quality Standards (NAAQS) for over five years.
Graded Response

Action Plan (GRAP)

  • The action plan was formulated in 2016 and notified in 2017 for Delhi and the National Capital Region (NCR).
  • GRAP includes the measures which will be taken by different government agencies to prevent worsening of Air Quality of Delhi-NCR and prevent PM10 and PM2.5 levels to go beyond the ‘moderate’ national Air Quality Index (AQI) category.
  • These are institutionalized measures to be taken when air quality deteriorates, hence works only as an emergency measure.
System of Air Quality and Weather Forecasting and Research (SAFAR)
  • SAFAR is a national initiative introduced by the Ministry of Earth Sciences to measure the air quality of a metropolitan city, by measuring the overall pollution level and the location-specific air quality of the city.
  • Objective: To increase awareness among the general public regarding the air quality in their city.
  • Functions of SAFAR:
    • It monitors all weather parameters like temperature, rainfall, humidity, wind speed, and wind direction, UV radiation, and solar radiation.
    • Pollutants monitored: PM2.5, PM10, Ozone, Carbon Monoxide (CO), Nitrogen Oxides (NOx), Sulfur Dioxide (SO2), Benzene, Toluene, Xylene, and Mercury.
    • It provides measurements of online automatic ultra-fine particles PM1, Black carbon and mercury which have direct impact on human health.
  • The World Meteorological Organization has recognized SAFAR as a prototype activity on the basis of the high-quality control and standards maintained in its implementation.
About National Air Quality Index (AQI)
  • Air Quality Index is a tool for effective communication of air quality status to people in terms, which are easy to understand.
  • It transforms complex air quality data of various pollutants into a single number (index value), nomenclature and colour.
  • There are six AQI categories, namely Good, Satisfactory, Moderately polluted, Poor, Very Poor, and Severe.
    • Each of these categories is decided based on ambient concentration values of air pollutants and their likely health impacts (known as health breakpoints).
    • AQ sub-index and health breakpoints are evolved for eight pollutants (PM10, PM2.5, NO2, SO2, CO, O3, NH3, and Pb) for which short-term (upto 24-hours) National Ambient Air Quality Standards are prescribed.
  • AQI Calculation:
    • The Sub-indices for individual pollutants at a monitoring location are calculated using its 24-hourly average concentration value (8-hourly in case of CO and O3).
    • All the eight pollutants may not be monitored at all the locations.
    • Overall AQI is calculated only if data are available for minimum three pollutants out of which one should necessarily be either PM2.5 or PM10.
For Reducing Vehicular Pollution
  • Bharat Stage Emission Standards (BSES):
    • These are the legal limits on the amount of air pollutants like carbon monoxide and particulate matter that a vehicle in India can emit.
    • These standards are targeted at making improvements in three areas i.e., emission control, fuel efficiency and engine design.
    • India has planned to shift to BS-VI norms from BS-IV from 2020.
  • Push for EVs: The government of India has launched so far – FAME-II, PLI SCHEME, and Battery Swapping Policy, Special Electric Mobility Zone, Tax Reduction on EVs.
  • Odd-Even System in NCR: Under the odd-even scheme, alternate days are marked for vehicles whose number plates end in odd and even numbers respectively. Vehicles with registration numbers ending in odd numbers are allowed on the roads on odd days and vehicles with even numbers on even days.

Sharing is caring!

Leave a comment

Your email address will not be published. Required fields are marked *