Table of Contents
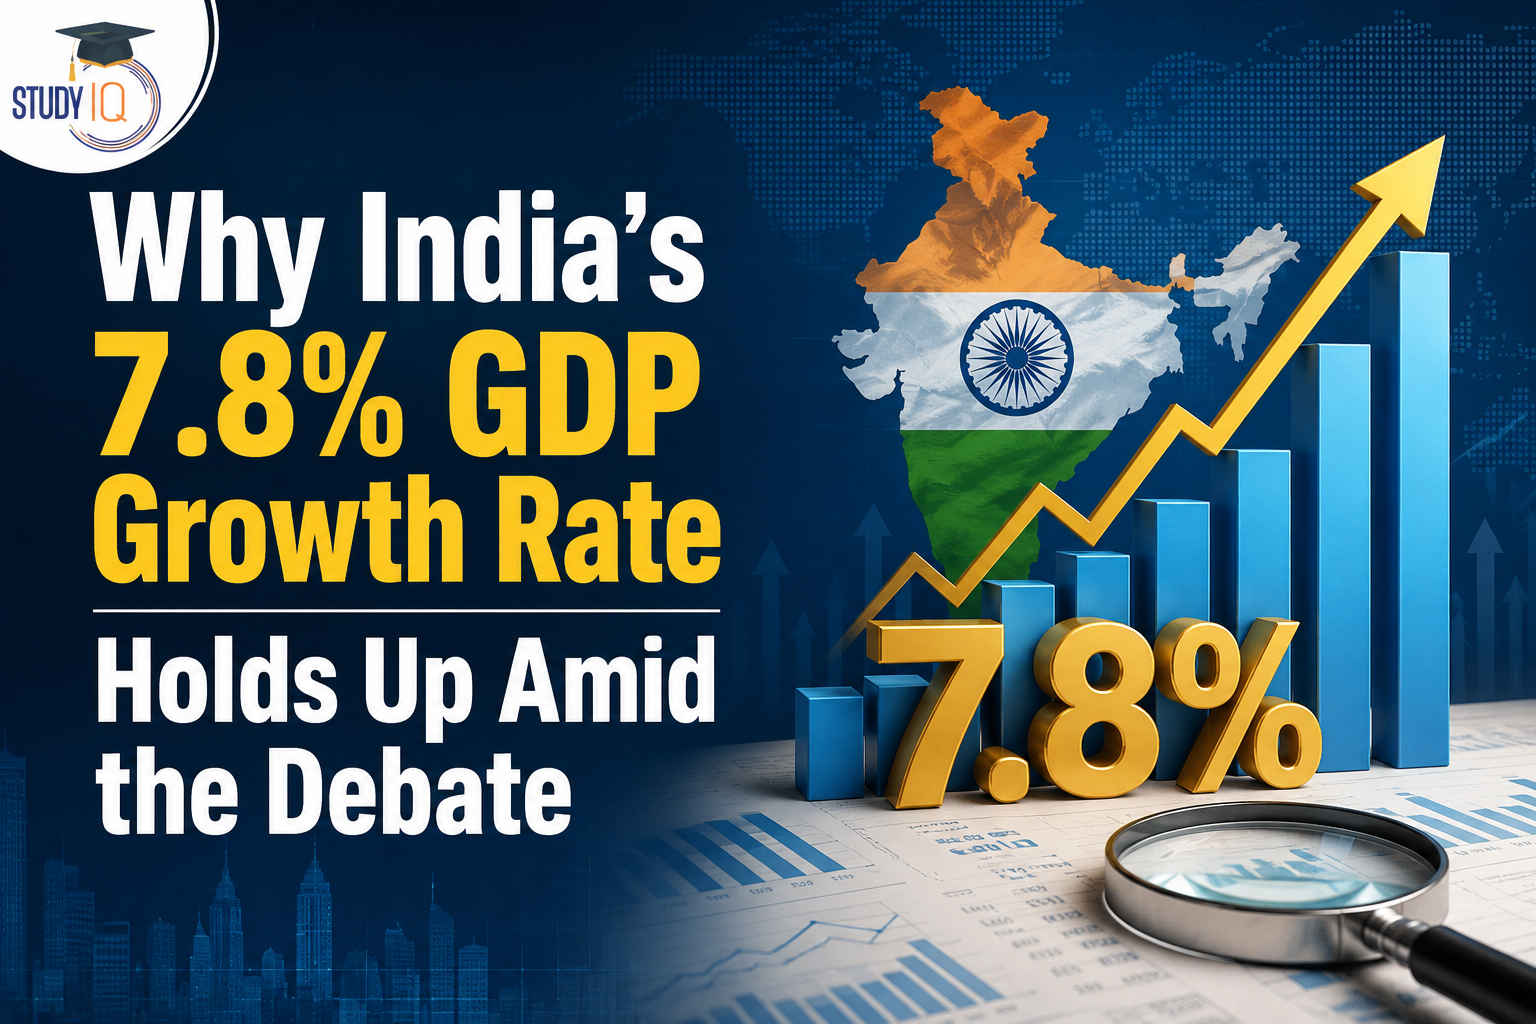
India’s Q1 FY27 GDP growth of 7.8% has triggered an intense debate over the credibility and interpretation of the latest economic data. While critics have questioned revisions under the new GDP series, government economists and SBI Research argue that the headline figure is broadly supported by economic fundamentals and that the widely cited 2.6% growth figure is based on an incorrect comparison of two different GDP series.
For UPSC aspirants, the issue is important from the perspective of the Indian Economy, GDP estimation, national income accounting, base-year revision, economic growth, and data interpretation.
Read Also: UPSC Daily Current Affairs 2026
India’s Q1 FY27 GDP Growth: Key Facts
According to the latest estimates:
- India’s real GDP grew by 7.8% year-on-year in Q1 FY27.
- GDP at current prices grew by 10.3%.
- Real Gross Value Added (GVA) increased by 8.2%.
- Growth was supported by manufacturing, services, consumption and investment activity.
- Several high-frequency indicators also remained strong during the quarter.
The figures indicate that the Indian economy began FY27 with relatively strong momentum despite an uncertain global economic environment.
Why Is India’s 7.8% GDP Growth Being Debated?
The controversy is largely linked to the introduction of the new GDP series with 2022-23 as the base year, replacing the earlier 2011-12 base year.
Critics have pointed to a substantial revision in the previous year’s nominal GDP. Under the earlier series, Q1 FY26 nominal GDP was reported at around ₹86 lakh crore, while the corresponding estimate under the new series was around ₹80 lakh crore.
Using the old-series Q1 FY26 figure against the new-series Q1 FY27 figure produces a much lower nominal growth rate of around 2.6%.
However, this comparison has a fundamental statistical problem.
The Problem of Comparing Two Different Series
GDP growth must be calculated using comparable data generated under the same methodology and series.
The frequently cited 2.6% calculation effectively compares:
Q1 FY27 GDP → New 2022-23 series
with
Q1 FY26 GDP → Old 2011-12 series
This is not a like-for-like comparison.
A simple analogy is comparing the performance of a company using its accounts prepared under two different accounting systems. The difference may reflect a change in methodology rather than a genuine change in economic activity.
What Does a Like-for-Like Comparison Show?
Under the revised 2022-23 base-year series, Q1 FY26 current-price GDP was estimated at around ₹80.3 lakh crore.
Q1 FY27 nominal GDP is around ₹88.3 lakh crore.
Therefore:
Nominal GDP growth ≈ 9.7%
This is considerably higher than the 2.6% figure produced by mixing the old and new series.
The distinction is crucial for understanding the current GDP controversy.
Why the 7.8% Figure Has Supporting Evidence
The strongest argument supporting the official GDP estimate is that GDP growth is not an isolated statistical number.
1. Strong GVA Growth
Real GVA grew by 8.2% during Q1 FY27.
GVA measures the value added by different sectors of the economy and therefore provides an important production-side perspective.
The strong GVA performance suggests that the expansion was supported by underlying economic activity rather than being purely an artefact of GDP calculation.
2. Manufacturing and Services
Manufacturing and services remained important contributors to economic expansion.
A broad-based increase across sectors makes it difficult to attribute the entire 7.8% GDP growth to a single statistical adjustment.
3. Consumption and Investment
Domestic demand remained an important pillar of growth.
Indicators such as passenger vehicle sales and tractor sales point towards continued consumer and rural demand, while investment-related indicators provide evidence of economic activity on the supply side.
4. GST Collections
GST collections provide a useful high-frequency indicator of formal economic activity.
Healthy GST collections during the quarter are broadly consistent with continued domestic economic expansion.
5. Industrial Indicators
Production of steel and cement, along with industrial production data, also points towards relatively strong economic activity.
These indicators do not independently prove the exact GDP growth rate, but their broad direction provides corroborative evidence.
Understanding the New GDP Series
A base year is used to measure changes in the volume of economic activity while reducing the influence of changing prices.
India periodically revises its GDP base year to ensure that national income statistics reflect structural changes in the economy.
The shift from 2011-12 to 2022-23 is therefore intended to provide a more contemporary representation of India’s economic structure.
A new series can also lead to revisions in historical estimates because improved datasets, methodologies, weights and price indices are incorporated.
Therefore, a downward revision in an earlier GDP level does not automatically imply that the new series is incorrect.
Why GDP Growth and GDP Level Must Be Distinguished
A crucial conceptual point for UPSC is the difference between:
GDP Level → Size/value of economic output in a particular period.
GDP Growth Rate → Percentage change in GDP between comparable periods.
A revision in the GDP level can occur because of changes in methodology or data sources. It does not necessarily mean that the previously reported growth rate was fabricated.
Therefore, GDP analysis must examine both:
Level → Methodology → Comparability → Growth Rate
rather than focusing on a single headline number.
Is the 7.8% Growth Rate Perfect?
Not necessarily.
While the 2.6% alternative calculation is problematic because it mixes GDP series, GDP data should still be subjected to rigorous scrutiny.
Three issues deserve attention:
- Frequent revisions can create uncertainty for researchers and policymakers.
- Changes in base year, deflators and methodology can affect measured growth.
- Headline GDP growth may not fully capture employment generation, income distribution or household welfare.
Thus, a high GDP growth rate should not automatically be interpreted as equivalent to broad-based improvements in living standards.
GDP Growth vs Economic Welfare
This distinction is particularly important for UPSC Mains.
GDP measures economic production, but it does not directly measure:
- Quality of employment
- Income inequality
- Poverty
- Environmental sustainability
- Human development
- Distribution of economic gains
Therefore, India needs both high economic growth and inclusive growth.
The real policy challenge is to convert strong GDP growth into:
Higher investment → More productive employment → Higher incomes → Greater consumption → Inclusive development
Conclusion
India’s 7.8% real GDP growth in Q1 FY27 should be examined through the lens of statistical methodology as well as underlying economic activity.
The widely cited 2.6% figure is not a valid like-for-like real GDP growth estimate, because it compares figures from different GDP series. A comparison using the revised 2022-23 base-year series produces a significantly stronger nominal growth picture.
However, the debate also highlights the need for transparent revisions, methodological clarity and stronger statistical communication.
For India, the ultimate test is not merely whether GDP grows at 7.8%, but whether such growth translates into productive employment, higher household incomes, investment, productivity gains and inclusive and sustainable development.

 Special Summary Revision (SSR) 2026–27...
 Global Hunger Index 2026: India Ranks 10...
 France Protests 2026: Cost of Living, Sc...














 WhatsApp