Table of Contents
Context: Finance Minister Nirmala Sitharaman stated that in the last decade, 25 crore people in India have been lifted out of multidimensional poverty.
Multidimensional Poverty: Basis For This Assessment
- Source of Data: NITI Aayog’s discussion paper titled ‘Multidimensional Poverty in India Since 2005-06′ released on January 15 provided the statistics.
- Poverty Decline: India’s multidimensional poverty rate dropped from 29.17% in 2013-14 to 11.28% in 2022-23.
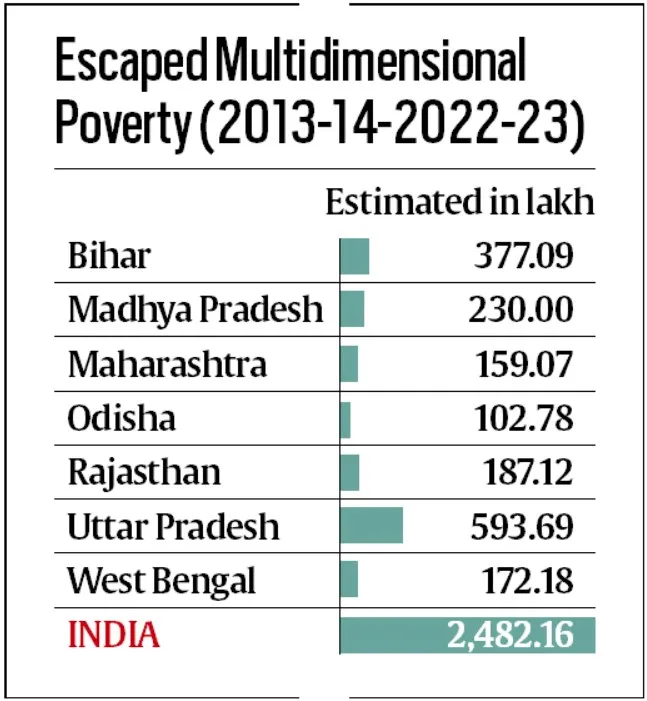
- Number Escaping Poverty: Approximately 24.82 crore individuals emerged from poverty during this period.
- State Contributions: Uttar Pradesh with 5.94 crore people overcoming poverty, followed by Bihar with 3.77 crore, and Madhya Pradesh with 2.30 crore.
We’re now on WhatsApp. Click to Join
About Multidimensional Poverty Index (MPI)
Traditional Poverty Measurement: Poverty has typically been measured by income or expenditure levels, with “poverty lines” reflecting minimum expenditure thresholds for poverty classification.
MPI’s Unique Approach
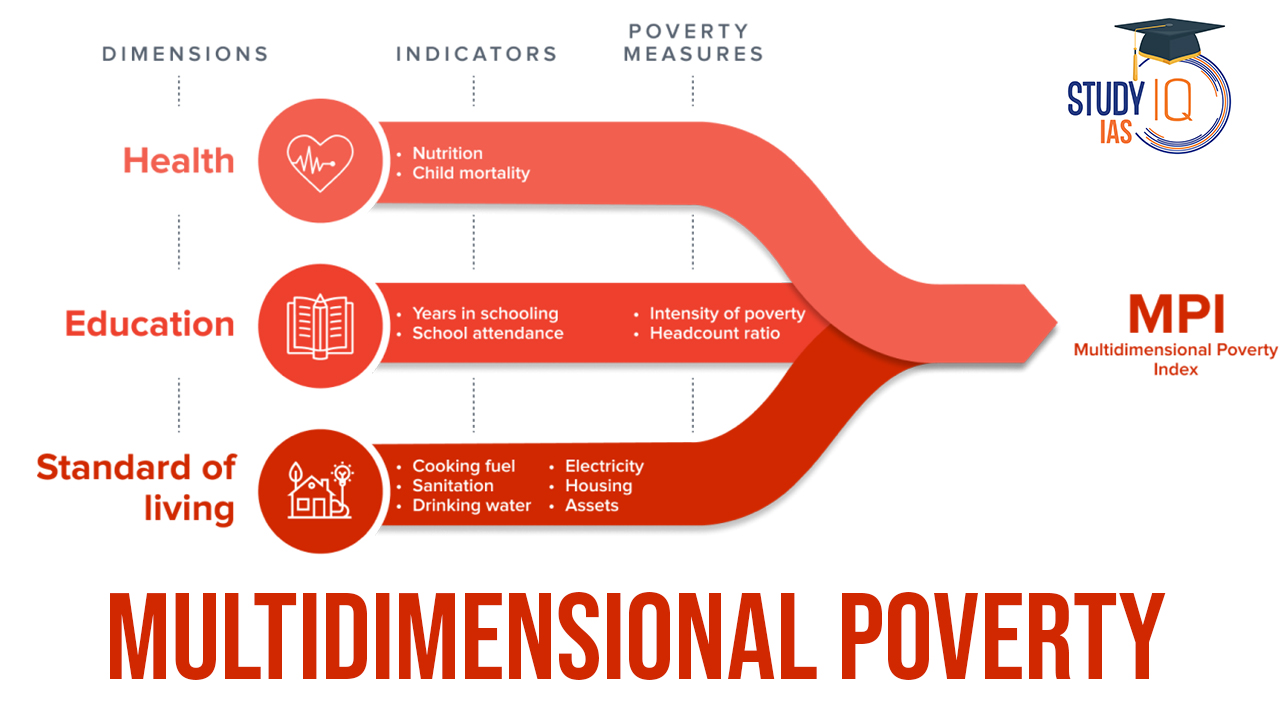
- Dimensional Coverage: The MPI assesses poverty through 10 indicators across three dimensions: health, education, and standard of living, each weighted equally in the index.
- Health Indicators: Nutrition and child & adolescent mortality.
- Education Indicators: Years of schooling and school attendance.
- Standard of Living Indicators: Housing, assets, cooking fuel, sanitation, water, and electricity.
- India-Specific Indicators: The Indian MPI includes maternal health and bank account ownership to reflect national priorities.
Multidimensional Poverty Index (MPI) Calculation Method
- Identification of the ‘MPI Poor‘: An individual is considered ‘MPI poor’ if they are deprived in one-third or more of the weighted indicators.
- Calculating Poverty Incidence (H): This represents the ratio of the number of people in multidimensional poverty to the total population, answering “How many are poor?”
- Calculating Poverty Intensity (A): This indicates the average level of deprivation experienced by the poor, answering “How poor are they?”
- Determining MPI Value: The MPI is calculated by multiplying the incidence (H) by the intensity (A) of poverty.
- Result Interpretation: The MPI reflects the proportion of weighted deprivations that MPI poor individuals face in relation to the total population.
|
Important Facts |
How were the data for 2013-14 and 2022-23 arrived at?
How then were the MPI for 2012-13 and 2022-23 calculated?
|
 International Yoga Day 2026: Theme, Hist...
 World Refugee Day 2026: Know Theme, Hist...
 Climate Change as a Cost-of-Living Crisi...