Table of Contents
Lorenz Curve
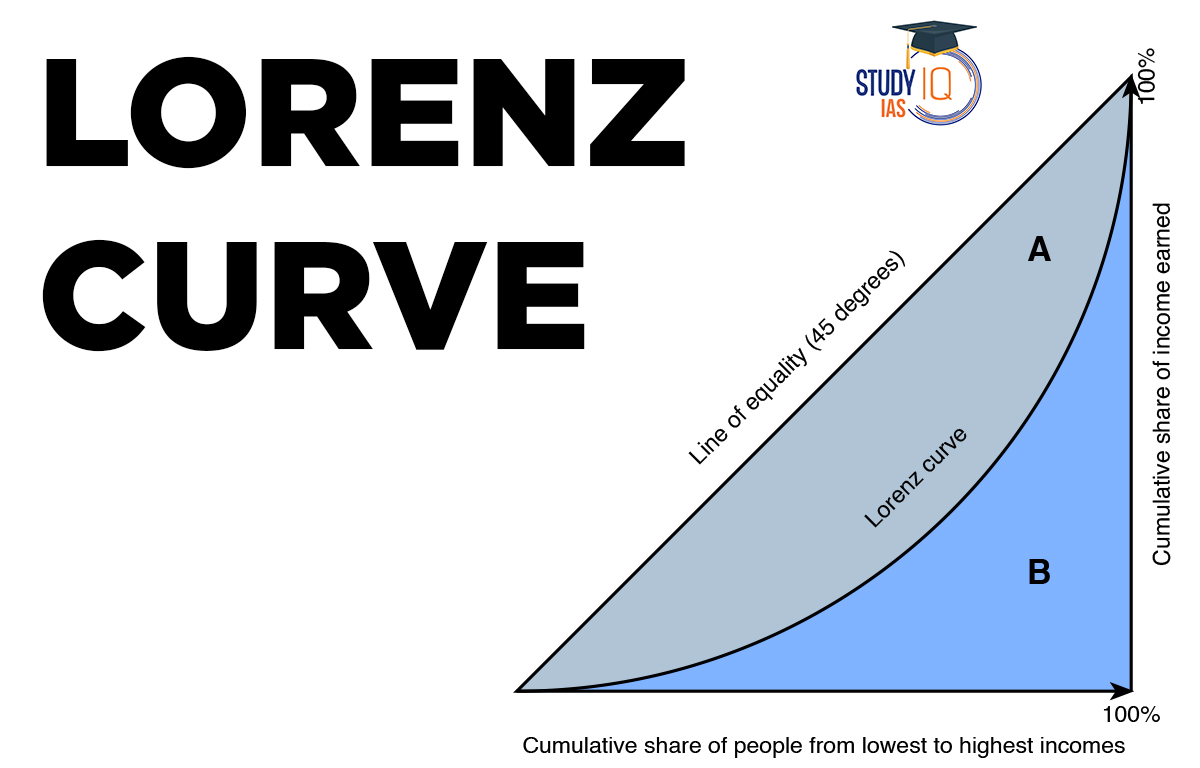
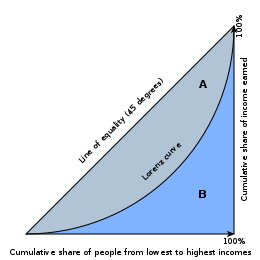
The Lorenz curve is a graphical representation of income distribution within a population. It is used to show the proportion of total income earned by a given percentage of households or individuals in a society. The curve is plotted by ranking households or individuals from lowest to highest income on the x-axis and plotting the cumulative share of total income earned by those households or individuals on the y-axis.
The resulting curve can be used to analyze income inequality in a given population and to compare income distribution across different countries or regions.
Read More: Basel Norms
Lorenz Curve Diagram
Here is a Diagram of the Lorenz Curve for a better understanding:
Lorenz Curve and Gini Coefficient
The Lorenz Curve and the Gini Coefficient are two related measures of income distribution. The Lorenz curve plots the cumulative share of income earned by a given percentage of households or individuals in a society, while the Gini coefficient is a summary measure of income inequality based on the Lorenz curve.
The Gini coefficient is calculated as the area between the Lorenz curve and the line of perfect equality (which represents a society where everyone earns an equal share of income), divided by the total area under the line of perfect equality. The resulting value ranges from 0 (perfect equality) to 1 (perfect inequality).
In other words, the Gini coefficient measures the degree of deviation of the Lorenz curve from the line of perfect equality. A society with a Lorenz curve that closely follows the line of perfect equality will have a Gini coefficient close to 0, indicating low-income inequality. Conversely, a society with a Lorenz curve that deviates significantly from the line of perfect equality will have a higher Gini coefficient, indicating greater income inequality.
Read More: Commercial Banks
Lorenz Curve Significance
The Lorenz curve is a useful tool for analyzing income distribution within a society. Here are some of its significant uses and applications:
- Measures Income Inequality: The Lorenz curve is a visual representation of income distribution within a population, which can be used to measure the degree of income inequality.
- Compares Income Distribution Across Countries: The Lorenz curve can be used to compare income distribution across different countries or regions, helping policymakers to identify areas where income inequality is particularly high or low.
- Helps to Design Social Policies: The Lorenz curve can be used to design social policies that address income inequality, by identifying the groups of people who are most affected by income inequality and targeting policies towards them.
- Evaluates Economic Growth: The Lorenz curve can be used to evaluate the distribution of economic growth across different income groups, by comparing the Lorenz curve for a particular year to that of a previous year.
- Helps to Assess Poverty: The Lorenz curve can be used to assess the level of poverty in a society, by identifying the proportion of households or individuals who earn less than a certain income threshold.
- Provides a Basis for the Calculation of Gini coefficient: The Lorenz curve provides the basis for the calculation of the Gini coefficient, which is a widely used measure of income inequality.
Read about: Inflation
Lorenz Curve UPSC
The Lorenz Curve is an important topic for the UPSC exam as it falls under the Economics UPSC Syllabus. Understanding the Lorenz curve and its applications is crucial for analyzing income distribution and income inequality within a population, which is an important area of concern for policymakers.
The UPSC exam often includes questions on this topic, and candidates can benefit from studying it in detail during their preparation. Moreover, many UPSC Online Coaching programs and UPSC Mock Test include questions related to the Lorenz curve, so mastering this topic can help candidates improve their scores and increase their chances of success in the exam.
Read about: Types of Inflation
 Foreign Contribution Regulation Act (FCR...
 What Are Forex Reserves? Components, Sig...
 Ramsar Convention 1971 Explained: Meanin...