Table of Contents
Context: Despite India scoring 25.5 on the Gini Index—placing it among the most equal societies—this does not reflect the ground reality.
Gini Coefficient
In simple terms, the Gini coefficient is a measure of how evenly or unevenly income or wealth is distributed in a society. A lower Gini coefficient indicates a more equal distribution, while a higher Gini coefficient suggests a greater concentration of income or wealth in a small percentage of the population.
What is the Gini Index?
- The Gini Index (or Gini Coefficient) is a statistical measure of income or wealth inequality within a nation or a group:
- It ranges between 0 and 1 (or 0 to 100 when expressed as a percentage).
- 0 represents perfect equality (everyone has the same income).
- 1 (or 100) represents perfect inequality (one person has all the income).
- A lower Gini Index implies more equality, while a higher score indicates greater inequality.
Significance of the Gini Index
- Economic Planning: Helps governments understand inequality trends and design targeted welfare schemes.
- Global Comparisons: Allows comparison of income distribution across countries.
- Social Insights: Highlights the potential risk of social unrest or marginalisation due to widening inequality.
- Development Indicator: Used as a component in broader indices like the Human Development Index (HDI) and World Bank reports.
Gini Coefficient Formula
The formula for calculating the Gini Coefficient is:
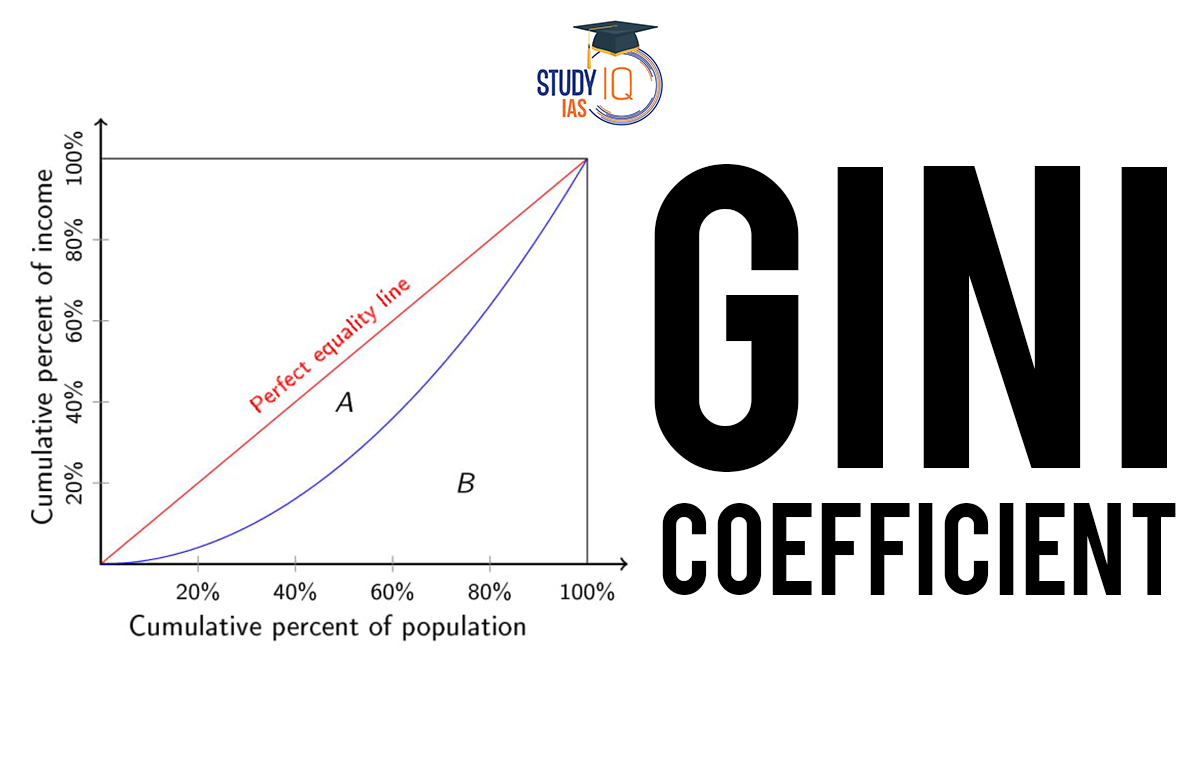
G = (A / (A + B))
Where:
G = Gini coefficient
A = area between the line of perfect equality and the Lorenz curve
B = total area under the line of perfect equality
The Lorenz Curve is a graph that shows the cumulative percentage of income or wealth on the vertical axis and the cumulative percentage of the population on the horizontal axis. The line of perfect equality is a straight diagonal line that represents perfect income or wealth equality.
To calculate A, you first divide the population into equal-sized groups, such as quintiles or deciles, and calculate the cumulative percentage of income or wealth held by each group. You then plot these percentages on the vertical axis of the Lorenz curve and connect the points to form a curve. A is then calculated as the area between this curve and the line of perfect equality.
To calculate B, you divide the total area under the line of perfect equality by 2. The resulting Gini coefficient ranges from 0 to 1, with 0 indicating perfect equality and 1 indicating perfect inequality.
How to Calculate Gini Coefficient?
To calculate the Gini coefficient, you need to follow these steps:
- Step 1: Arrange the population by their income or wealth, from the poorest to the richest.
- Step 2: Calculate the cumulative percentage of the total income or wealth held by each percentile of the population. For example, the cumulative percentage of the total income or wealth held by the bottom 10%, 20%, 30%, and so on, up to 100%.
- Step 3: Plot the cumulative percentages on a graph, with the cumulative percentage of the population on the x-axis and the cumulative percentage of income or wealth on the y-axis. This graph is known as the Lorenz curve.
- Step 4: Calculate the area between the Lorenz curve and the line of perfect equality, which represents a society with perfect income or wealth equality. This area is denoted as “A”.
- Step 5: Calculate the total area under the line of perfect equality. This area is denoted as “B”.
- Step 6: Divide “A” by “B”, and then multiply the result by 100. This gives you the Gini coefficient as a percentage.
The resulting Gini coefficient will be a number between 0 and 100, with 0 indicating perfect income or wealth equality, and 100 indicating perfect income or wealth inequality.
Gini Coefficient and Lorenz Curve
The Lorenz curve and the Gini coefficient are two related measures of income or wealth inequality.
The Lorenz curve is a graphical representation of the distribution of income or wealth in a society. It plots the cumulative percentage of the total income or wealth held by the bottom x% of the population, against the cumulative percentage of the population from the bottom. The Lorenz curve is a curved line that typically lies below the line of perfect equality, which represents a society in which everyone has an equal share of income or wealth.
The Gini coefficient is a numerical measure of inequality that can be calculated from the Lorenz curve. It is calculated as the ratio of the area between the Lorenz curve and the line of perfect equality to the total area under the line of perfect equality. The resulting number ranges from 0 to 1, with 0 indicating perfect equality and 1 indicating perfect inequality.
In other words, the Lorenz curve shows the actual distribution of income or wealth in a society, while the Gini coefficient summarises that distribution into a single number. The Gini coefficient can be useful for comparing the level of inequality between different societies or over time, but it does not provide as detailed information as the Lorenz curve.
How the Gini Index May Be Wrong About India
- Excludes Informal Sector: A large portion of India’s workforce (over 90%) is employed in the informal sector, where income data is not captured accurately.
- Gini calculations are based on income or tax data, which excludes the vast informal population, underreporting actual inequality.
- Data Gaps & Tax Thresholds: Only a small fraction (less than 10%) of India’s adult population files taxes.
- This creates data distortion, as the wealthiest underreport income while the poorest are invisible to the system.
- Ignores Wealth Inequality: The Gini Index mostly focuses on income, not wealth.
- India has some of the highest wealth concentration rates—the top 1% holds over 6% of national income, reflecting severe wealth inequality that Gini misses.
- Does Not Capture Intersectional Inequalities: It does not account for gender, caste, regional, education, or digital inequalities—all of which are structurally embedded in Indian society.
- g., Only 25% of rural women have Internet access, compared to 49% of rural men, which affects economic participation and autonomy.
- Uneven Access to Services: The Gini Index doesn’t consider non-monetary disparities like Access to quality education, Health services, and Digital infrastructure.
- These deeply affect life opportunities and intergenerational mobility.
- Urban-Rural & Intra-Urban Inequality Hidden: Averages used in Gini can mask wide inequalities within cities or regions.
- Eg., A luxury car owner and a domestic worker in the same neighbourhood may have drastically different lives, but such micro-level disparities are lost in national averages.
While the Gini Index is a useful statistical tool, its methodology oversimplifies inequality in complex societies like India. It misses informal economies, wealth concentration, and layered inequalities like gender, digital, and caste-based discrimination. Hence, despite a low Gini score, India remains deeply unequal in lived realities, and any celebration based on the index should be approached with caution and critical analysis.
The Gini coefficient is an important topic for UPSC aspirants as it is part of the UPSC Syllabus for various exams such as the Civil Services Preliminary and Mains Examination.
| Related Articles | |
| GDP Deflator | GDP of Indian States |
| Basel Norms | Types of Inflation |
 SEBI’s SWAGAT-FI Framework for Low-Ris...
 Out-of-Pocket Health Expenditure, Reason...
 Treasury Bills (T-bills): RBI Cuts Holdi...