Table of Contents
Context
India’s air pollution crisis is not a gap in scientific knowledge but a gap in institutional attention, political commitment and investment. Flashy fixes such as smog towers and artificial rain cannot take their place.
GS Syllabus Mapping
GS Paper 3 (Environment): Conservation; environmental pollution and degradation; environmental impact assessment.
Post-Read Question
Describe the key points of the revised Global Air Quality Guidelines (AQGs) recently released by the World Health Organisation (WHO). How do they differ from the 2005 update? What changes to India’s National Clean Air Programme are needed to meet these revised standards? (UPSC Mains 2021, 15 Marks)
Causes / Drivers of Air Pollution
Air pollution is a year-round, national problem, not just a Delhi winter issue. Most sources pollute all year, and some add seasonal peaks.
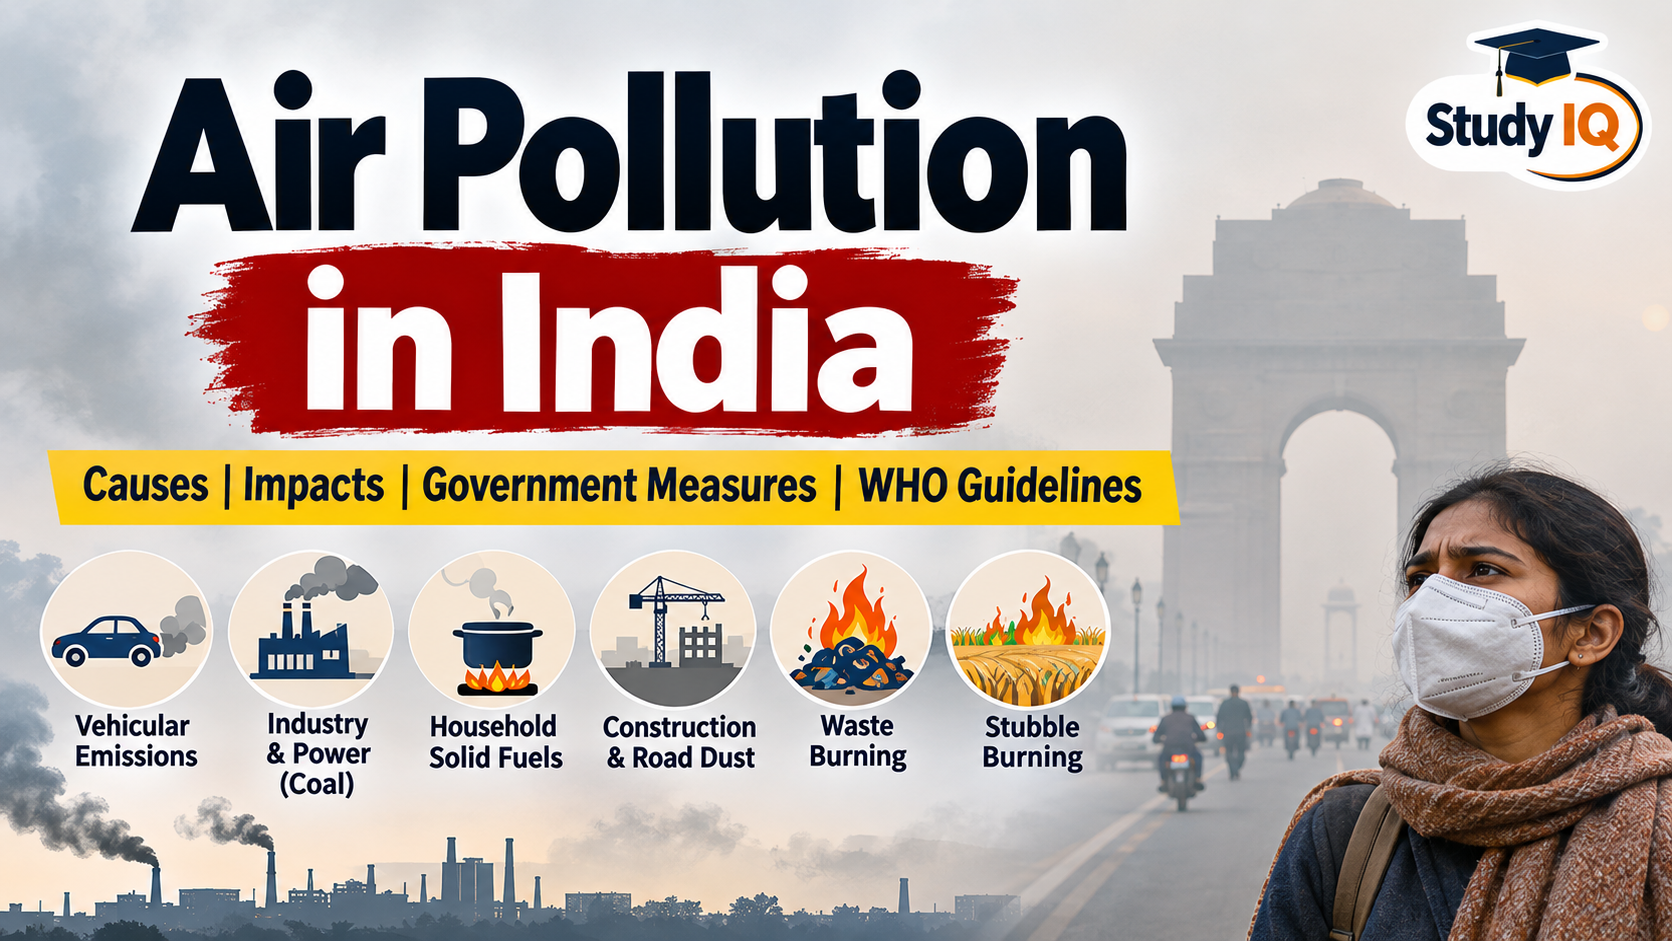
- Vehicular emissions: about 21% contribution to pollution (IIT Delhi report).
- Household solid fuels: 47% of rural households rely on firewood as their primary cooking fuel (HCES 2023-24).
- Industry and power: coal-based thermal plants, brick kilns and small industries. Over 70% of electricity needs are met by coal.
- Construction and road dust: unregulated construction activity and unpaved roads raise PM10 levels.
- Waste burning: poor municipal solid waste management leads to open burning of garbage and landfill fires.
- Agricultural residue burning (seasonal): the paddy-wheat cycle in Punjab and Haryana leaves a narrow sowing window, so farmers burn stubble.
- Firecrackers and meteorology (seasonal): festive firecrackers add to emissions, and winter meteorology (low wind, temperature inversion) traps pollutants. Weather amplifies pollution but does not create it, because the emissions are man-made.
Why Is Air Pollution a Governance Problem, Not Just a Scientific One?
- The knowledge-action gap: the sources are well known. We do not need to quantify every source precisely before acting. Research should refine interventions, not delay them. The real bottleneck is institutional capacity, funding and coordination.
- Airsheds cross boundaries: pollution crosses state and municipal boundaries, but governance is fragmented across jurisdictions. This weakens accountability.
- Weak enforcement: State Pollution Control Boards face staff shortages and limited powers, so regulation often stays on paper.
- A narrow idea of expertise: policy listens mainly to atmospheric scientists, engineers and doctors. It overlooks agricultural economists, social scientists and practitioners on the ground who understand behaviour and incentives.
- Short-termism: action spikes during winter emergencies (GRAP) and fades afterwards. Sustained, year-round political commitment is missing.
How Does Air Pollution Deepen Inequality?
- Unequal exposure: outdoor workers (vendors, construction and sanitation workers) and communities near industry face the highest exposure but have the fewest choices.
- Livelihood over health: for many, earning a living takes precedence over avoiding pollution. Advice to “stay indoors” is not an option for them.
- The gender burden: household cooking falls disproportionately on women. Ambient data is not the same as exposure: a rooftop monitor cannot capture what a woman breathes while cooking with solid fuels indoors, so this exposure is missing from official figures.
- Health and income loss: pollution causes respiratory and cardiovascular diseases, which lead to out-of-pocket health spending and lost workdays.
- Intergenerational harm: exposure in children impairs lung development and cognition, creating a lasting human capital deficit.
Government Measures
- National Clean Air Programme (NCAP), 2019: a city-specific action plan for non-attainment cities, with performance-linked funding through the 15th Finance Commission grants.
- Commission for Air Quality Management (CAQM) Act, 2021: a statutory body for NCR and adjoining areas to coordinate action across states.
- Graded Response Action Plan (GRAP): emergency measures that tighten as the AQI worsens.
- Pradhan Mantri Ujjwala Yojana: LPG connections for poor households to replace solid fuels.
- Vehicle norms and mobility: the leap from BS-IV to BS-VI (2020), FAME and PM E-DRIVE for electric vehicles, and the vehicle scrappage policy.
- Crop residue management: subsidised in-situ machinery (Happy Seeder) and bio-decomposers, and the use of paddy straw in thermal power plants.
WHO Global Air Quality Guidelines, 2021 (Changes from 2005)
- Much stricter limits: almost all safe thresholds were cut. Most notably, annual PM2.5 was halved (10 → 5 µg/m³) and annual NO₂ was cut by 75% (40 → 10 µg/m³). The only increase was 24-hour SO₂ (20 → 40 µg/m³), based on updated methodology.
- New averaging windows: it added timeframes missing in 2005: peak-season ozone (O₃), 24-hour NO₂ and 24-hour carbon monoxide (CO).
- Emerging pollutants addressed: it introduced qualitative Good Practice Statements for black carbon, ultrafine particles and sand/dust storms, which had no benchmarks in 2005.
- Lower safe-threshold evidence: it draws on global evidence that health damage occurs at much lower concentrations than previously thought.

 Cyclone Akvan 2026: Landfall Forecast, W...
 Quad Summit 2026: Outcomes, India's Role...
 Voyager 1 to Reach One Light-Day from Ea...













 WhatsApp