Table of Contents
Context: India’s “invisibles” trade is today bigger than the “visible” merchandise trade account in its external balance of payments.
What is Visible and Invisible Trade?
Visible Trade (Goods/Merchandise)
- Involves the export and import of physical goods.
- Includes items like textiles, leather, steel, aluminium, machinery, oil, electronics, etc.
Invisible Trade (Non-Merchandise)
- Comprises transactions that do not involve physical goods.
- Key components:
- Services exports – IT/software, business, financial, R&D, consultancy, communication.
- Private transfers – Remittances from Indians working abroad.
- Investment flows (FDI, FPI) – Though not included in gross invisible receipts here.
India’s Foreign Trade Status (2024–25)
Visible Trade (Merchandise Trade)
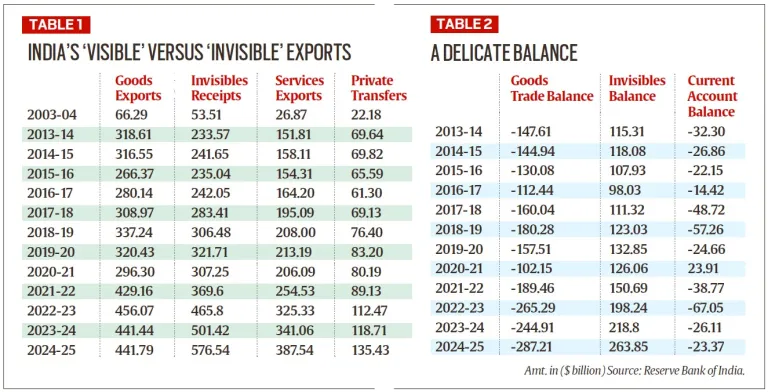
- Merchandise Exports: $441.8 billion
- Slightly lower than the previous year ($456.1 billion in 2022–23).
- Merchandise Imports: $729 billion
- Driven by imports of crude oil, electronics, gold, machinery, etc.
- Goods Trade Deficit: $287.2 billion
- India’s highest-ever merchandise trade deficit.
Invisible Trade (Non-Merchandise)
- Gross Invisible Receipts: $576.5 billion
- Includes services exports and private remittances.
- Services Exports: $387.5 billion
- Led by software, business, financial, communication, and consultancy services.
- Remittances (Private Transfers): $135.4 billion
- Money is sent by Indian workers and NRIs from abroad.
- Services Trade Surplus: $188.8 billion
- Services exports ($387.5B) minus services imports ($198.7B).
- Net Invisible Surplus: $263.8 billion
- Includes both services and private transfers; helped offset the merchandise trade deficit.
- Current Account Deficit (CAD): $23.4 billion
- Lower than the $32.3 billion CAD recorded in 2013–14 due to strong performance in invisibles.
India’s Foreign Trade Comparison with China (2024)
| Indicator | India (2024–25) | China (2024) | Insights |
| Goods Exports | $441.8 billion | $3,409 billion | China is a manufacturing/export powerhouse |
| Goods Imports | $729 billion | $2,641 billion | India imports more than it exports; China has a strong trade surplus |
| Merchandise Trade Balance | – $287.2 billion | + $768 billion | India has a deficit, China a large surplus |
| Services Exports | $387.5 billion | $384 billion | India slightly leads |
| Services Imports | $198.7 billion | $613 billion | China imports far more services |
| Net Services Trade | + $188.8 billion | – $229 billion | India has a significant surplus |
| Net Invisibles (Total) | + $263.8 billion | – $344.1 billion | India earns from invisibles; China spends more |
| Current Account Balance | – $23.4 billion (deficit) | + $423.9 billion (surplus) | China’s surplus is sustained by goods trade; India cushions the deficit via invisible |
 SEBI’s SWAGAT-FI Framework for Low-Ris...
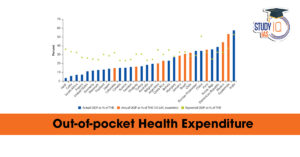 Out-of-Pocket Health Expenditure, Reason...
 Treasury Bills (T-bills): RBI Cuts Holdi...