Table of Contents
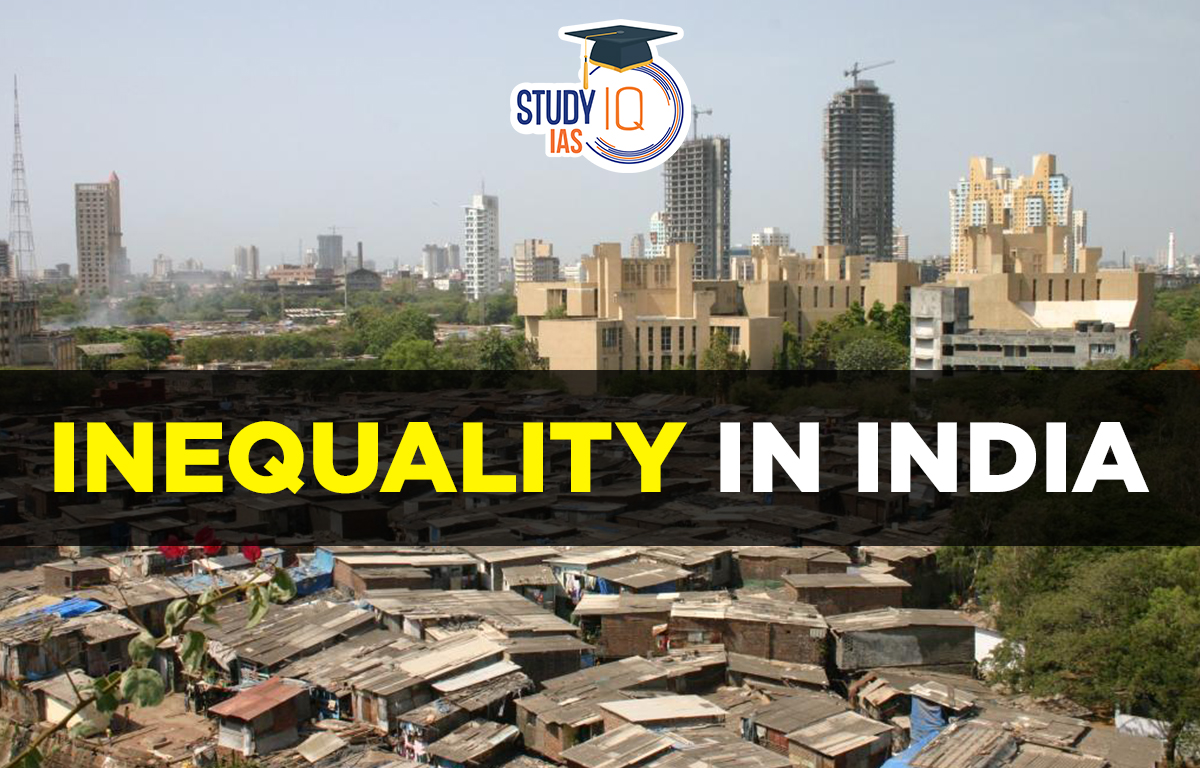
Context: India’s inequality debate reignited after a 2025 World Bank report claimed a significant decline in poverty and consumption inequality, prompting both praise and scepticism about data validity and broader interpretations.
About Inequality
- It is an unfair situation in society when some people have more opportunities than others people.
- The United Nations describes it even more simply as “the state of not being equal, especially in status, rights and opportunities”.
- Gini coefficient is a typical measure of income inequality.
2025 World Bank Report Findings on Inequality in India
- India has nearly eradicated extreme poverty, pulling around 27 crore people out of poverty between 2011 and 2023.
- Consumption inequality has declined, with the Gini coefficient falling from 8 (2011-12) to 25.5 (2022-23).
- The bottom 20% of the population has shown notable dietary and asset improvements, even excluding free food and cash transfers.
- India now ranks among the top four least unequal countries globally in consumption terms.
- The findings are based on HCES 2022-23, which used the Modified Mixed Reference Period (MMRP) — a method aligned with international best practices.
Issues with the World Bank Report Findings
- HCES does not fully capture elite/top 5% consumption, which may underestimate actual inequality.
- Consumption inequality ≠ Income inequality; income data is lacking, and comparisons can be misleading.
- World Inequality Lab (WIL) estimates of income inequality are based on implausible assumptions, such as most households spending more than they earn.
- Eg., WIL estimates suggest that 70–80% of households spend more than they earn, year after year — a logically inconsistent assumption.
- WIL uses pre-tax income, ignoring India’s substantial welfare transfers and tax redistribution, skewing perceived inequality.
- Eg., In AY 2023-24, the top 1% of taxpayers paid 72.77% of total taxes, but this isn’t reflected in WIL’s pre-tax inequality figures.
- Media often misrepresents inequality by overemphasising the top 1% shares without acknowledging data flaws or post-tax realities.
Way Forward
- Develop official, robust income surveys to track income distribution directly.
- Incorporate post-tax and post-transfer effects in inequality measurement.
- Improve data collection on high-income households and elite consumption.
- Distinguish clearly between income and consumption-based inequality in public discourse.
- Focus policy on equal access to quality education, healthcare, and employment to address structural inequalities.
- Recognise and celebrate progress while staying vigilant about remaining gaps.


 Particularly Vulnerable Tribal Groups (P...
 Geo-tagging of Buildings During Upcoming...
 Gender Gap in Educational Expenditure in...


