Table of Contents
Context
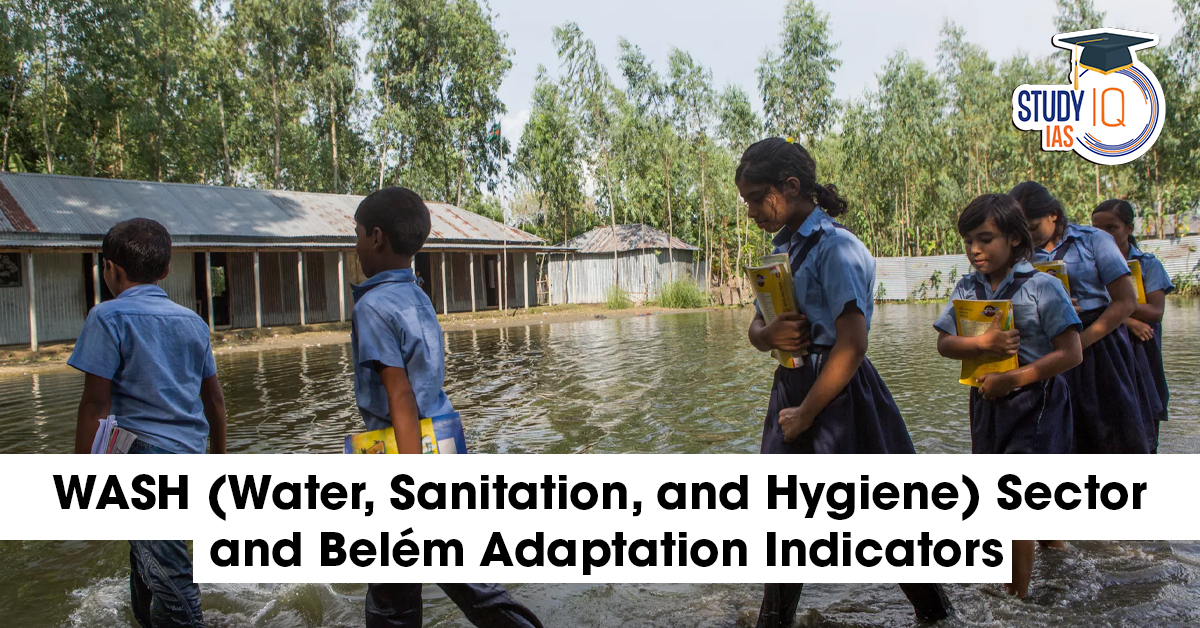
COP 30 (dubbed the “COP of Implementation”) transformed climate adaptation from an abstract concept into a measurable discipline, placing water security and the WASH (Water, Sanitation, and Hygiene) sector at the heart of global climate accountability.
India’s alignment with Belem Indicators’ WASH (Water, Sanitation, and Hygiene) Metric
| Indian Initiative | Link to Belém Indicators |
| NAQUIM 2.0 | National Aquifer Mapping; moving from “mapping” to “management plans” for groundwater resilience. |
| NMCG (Namami Gange) | Evolution from sewage treatment to digital monitoring and biodiversity-led river rejuvenation. |
| Jal Jeevan Mission | Universal drinking water access; now requires “climate stress testing” of rural supply lines. |
| Water Vision 2047 | A long-term blueprint for water security, equity, and sustainability. |
Systemic Risks & Challenges
- Water Scarcity Distribution: Climate disasters in India are predominantly water-related (floods/saline intrusion). Supply figures must move from “coverage” to “redundancy” (systems that work during disasters).
- Adaptation Finance Gap: Global goal of $1.3 trillion annually by 2035. India requires water projects to be classified as “Climate Investments” to attract this capital.
- Digital Fragmentation: The need to integrate India’s Digital Public Infrastructure (DPI) with real-time hydrological and meteorological data for AI-driven local planning.
|
Belém Adaptation Indicators |
||||||||||||||
| ● Under the UAE Framework for Global Climate Resilience, COP 30 adopted 59 specific indicators to track progress on the Global Goal on Adaptation (GGA).
● These represent the first standardized global attempt to measure whether humanity is actually becoming more resilient to climate change. ● The indicators are grouped into seven thematic areas
|
|
Read More Notes |
|
| Environment Notes | Art and Culture Notes |
| Science and Tech | History Notes |
| Geography Notes | Indian Polity Notes |
| General Knowledge | International Relation |
|
Explore StudyIQ Courses |
|
 The Transgender Persons (Protection of R...
 Vairamuthu Wins Jnanpith Award 2026: Tam...
 Assam Peace Settlement with Hmar and Kuk...