Table of Contents
The Economic Survey 2026, tabled in Parliament by Union Finance Minister Smt. Nirmala Sitharaman presents a comprehensive picture of India’s economic resilience, macroeconomic stability, and long-term development vision. Against the backdrop of a fragile global economy marked by geopolitical tensions, trade fragmentation, and financial volatility, India has emerged as the fastest-growing major economy for the fourth consecutive year.
The Survey positions India not only as a growth leader but as a nation transitioning from “self-reliance” to strategic resilience and ultimately to strategic indispensability in global value chains.
Economic Survey 2026 Overview
The Economic Survey 2026 highlights India’s strong and resilient economic performance amid global uncertainty. It projects robust GDP growth, low inflation, improved banking stability, rising exports, and strengthened fiscal discipline. The Survey emphasizes infrastructure expansion, manufacturing revival, digital and AI-led growth, social sector progress, and a strategic shift from self-reliance to strategic resilience and global indispensability.
| Aspect | Key Highlights |
|---|---|
| Growth | Real GDP growth projected at around 7.4%, among the highest globally |
| Inflation | Averaged at historic low levels, around 1.7% |
| Fiscal Position | Revenue receipts at 9.2% of GDP, credible fiscal consolidation |
| Banking Sector | GNPA at multi-decadal low of 2.2% |
| External Sector | Forex reserves at USD 701.4 billion, strong export performance |
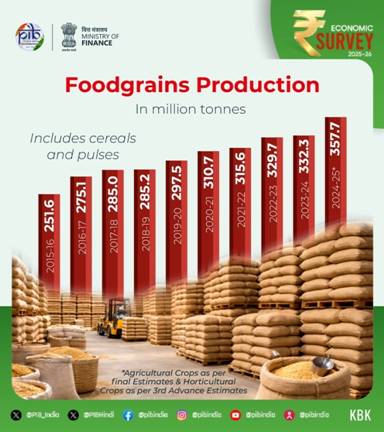
| Agriculture | Record foodgrain production of 3,577.3 LMT |
| Industry | Manufacturing recovery, strong PLI impact |
| Infrastructure | Rapid expansion of highways, railways, airports |
| Energy | India ranks 3rd globally in renewable energy capacity |
| Social Sector | Improved education access, health indicators, and poverty reduction |
| Strategic Vision | Shift from Swadeshi to Strategic Resilience and Strategic Indispensability |
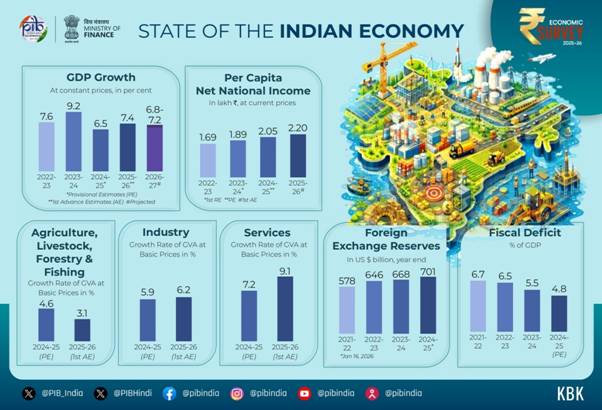
State of the Economy: Growth with Stability
The First Advance Estimates (FAE) project:
-
Real GDP growth for FY26: 7.4%
-
GVA growth: 7.3%
-
Potential growth rate: Around 7%
-
FY27 growth projection: 6.8%–7.2%
This makes India the world’s fastest-growing major economy for the fourth year in a row.
Demand-Side Drivers
-
Private Final Consumption Expenditure (PFCE): Grew by 7%, accounting for 61.5% of GDP, the highest since 2012.
-
Supported by:
-
Low inflation
-
Stable employment
-
Rising real incomes
-
Strong rural demand due to good agricultural performance
-
Recovery in urban consumption aided by tax rationalisation
-
Investment Momentum
-
Gross Fixed Capital Formation (GFCF): Grew by 7.8%, remaining steady at 30% of GDP.
-
Driven by:
-
Sustained public capital expenditure
-
Revival in private investment activity
-
Supply-Side Trends
-
Services sector remains the primary growth engine:
-
GVA growth in services (H1 FY26): 9.3%
-
Full-year estimate: ~9.1%
-
Fiscal Developments: Anchoring Stability Through Credible Consolidation
India’s fiscal policy is marked by discipline combined with growth-oriented spending.
Key Achievements
-
Revenue receipts: Increased to 9.2% of GDP in FY25
-
Effective capital expenditure: Nearly 4% of GDP in FY26
-
Government debt-to-GDP ratio: Reduced by 7.1 percentage points since 2020
-
Three sovereign rating upgrades in 2025:
-
Morningstar DBRS
-
S&P Global Ratings
-
Rating and Investment Information (R&I), Japan
-
Tax Performance
-
Income tax returns:
-
FY22: 6.9 crore
-
FY25: 9.2 crore
-
-
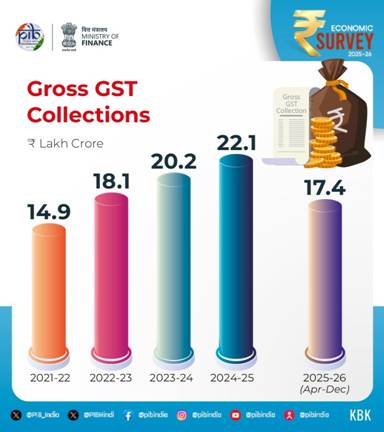
GST collections (Apr–Dec 2025):
-
₹17.4 lakh crore
-
Growth: 6.7% YoY
-
Support to States
-
Through Special Assistance to States for Capital Investment (SASCI), states maintained capex at ~2.4% of GDP.
Monetary Management & Banking Sector
India’s banking system is at its strongest in decades.
| Indicator | Status |
|---|---|
| Gross NPA | 2.2% (Sept 2025) – Multi-decadal low |
| Net NPA | 0.5% – Record low |
| Credit growth | 14.5% YoY |
| Financial assets | 187% of GDP |
The IMF–World Bank Financial Sector Assessment Program (FSAP 2025) praised India’s regulatory quality and financial resilience.
Financial Inclusion and Capital Markets
-
PM Jan Dhan Yojana:
-
55.02 crore accounts
-
36.63 crore in rural/semi-urban areas
-
-
Mudra Yojana:
-
₹36.18 lakh crore disbursed
-
55.45 crore loan accounts
-
-
Equity Market Participation:
-
Demat accounts: 21.6 crore+
-
Unique investors: 12 crore+
-
Women investors: ~25%
-
-
e-Shram Portal:
-
31 crore unorganised workers
-
54% women
-
This reflects deepening democratization of finance.
External Sector: Playing the Long Game
India’s external sector shows strong diversification and resilience.
Trade and Exports
-
India’s share of global exports:
-
Merchandise: 1% → 1.8% (2005–2024)
-
Services: 2% → 4.3%
-
-
FY25 Exports:
-
Total: USD 825.3 billion
-
Services: USD 387.6 billion (↑13.6%)
-
Non-petroleum exports: USD 374.3 billion
-
-
Remittances:
-
USD 135.4 billion – Highest globally
-
-
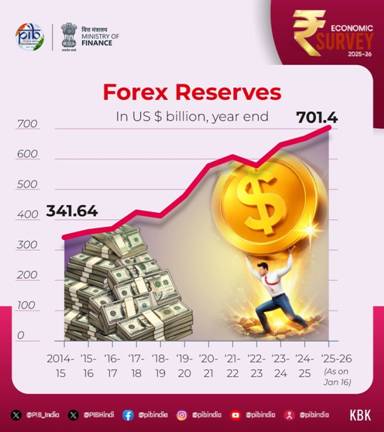
Forex Reserves:
-
USD 701.4 billion (Jan 2026)
-
11 months import cover
-
94% external debt cover
-
India ranked:
-
4th globally in greenfield investments (2024)
-
Largest destination for greenfield digital investments (2020–24)
Inflation: Tamed and Anchored
-
Average CPI inflation (Apr–Dec 2025): 1.7%
-
Lowest since the beginning of CPI series
-
Driven by:
-
Decline in food and fuel prices
-
Effective supply management
-
Among EMDEs, India recorded one of the sharpest declines in inflation.
Agriculture & Food Management
-
Foodgrain production (AY 2024–25):
-
3,577.3 LMT, up by 254.3 LMT
-
-
Horticulture production:
-
362.08 million tonnes, surpassing foodgrains
-
-
e-NAM platform:
-
1.79 crore farmers
-
1,522 mandis
-
-
PM-KISAN:
-
₹4.09 lakh crore transferred
-
21 instalments completed
-
Agriculture is shifting from subsistence to diversification, value chains, and market integration.
Industry & Manufacturing Revival
Manufacturing is regaining momentum:
| Quarter | Manufacturing GVA Growth |
|---|---|
| Q1 FY26 | 7.72% |
| Q2 FY26 | 9.13% |
PLI Scheme Impact
-
Investment: ₹2 lakh crore+
-
Production: ₹18.7 lakh crore+
-
Jobs: 12.6 lakh+
Semiconductor Push
-
10 projects approved
-
Investment: ₹1.60 lakh crore
-
Across 6 states
India’s Global Innovation Index rank improved to 38th in 2025.
Infrastructure: Backbone of Growth
-
Capital expenditure:
-
₹2.63 lakh crore (FY18) → ₹11.21 lakh crore (FY26 BE)
-
Transport
-
National highways:
-
91,287 km → 1,46,572 km
-
-
High-speed corridors:
-
550 km → 5,364 km
-
-
Railways:
-
99.1% electrified
-
-
Airports:
-
74 (2014) → 164 (2025)
-
-
India is now the 3rd largest domestic aviation market
Energy & Climate
-
Installed power capacity: 509.74 GW
-
Renewable share: ~49.83%
-
India ranks 3rd globally in RE and solar capacity
-
DISCOMs recorded:
-
First-ever profit: ₹2,701 crore (FY25)
-
Space and Science
India became the fourth nation to achieve autonomous satellite docking (SPADEX), strengthening strategic and commercial space capabilities.
Education & Health
Education
-
GER:
-
Primary: 90.9
-
Upper Primary: 90.3
-
Secondary: 78.7
-
-
Institutions:
-
23 IITs
-
21 IIMs
-
20 AIIMS
-
IIT campuses in Zanzibar & Abu Dhabi
-
Health
-
Since 1990:
-
MMR ↓ 86%
-
U5MR ↓ 78%
-
NMR ↓ 70%
-
India is outperforming global averages in health outcomes.
Employment & Skilling
-
Total employed (Q2 FY26): 56.2 crore
-
New jobs added: 8.7 lakh in Q2
-
e-Shram: 31 crore workers
-
NCS Portal:
-
59 million job seekers
-
80 million vacancies
-
Poverty Reduction
-
MPI:
-
2005–06: 55.3%
-
2022–23: 11.28%
-
-
World Bank revised poverty line (USD 3/day):
-
Extreme poverty: 5.3%
-
Lower-middle poverty: 23.9%
-
From Swadeshi to Strategic Indispensability
The Survey proposes Disciplined Swadeshi, a three-tier framework:
-
Critical strategic vulnerabilities
-
Economically feasible strategic capabilities
-
Low-priority or high-cost substitutions
Goal:
“From thinking about buying Indian to buying Indian without thinking.”
This is India’s transition:
Self-Reliance → Strategic Resilience → Strategic Indispensability
Conclusion
The Economic Survey 2025–26 presents India as a nation entering a new development phase—where growth is high, inflation is low, fiscal management is credible, banking is stable, exports are diversified, and manufacturing is resurging.
It is no longer just about becoming self-reliant; it is about becoming indispensable to the world economy.
|
Read More Notes |
|
| Environment Notes | Art and Culture Notes |
| Science and Tech | History Notes |
| Geography Notes | Indian Polity Notes |
| General Knowledge | International Relation |
|
Explore StudyIQ Courses |
|
 Supreme Court Upholds the Right to Die w...
 GDP Growth vs Employment Reality: Unders...
 Bill to Codify IPS Deputation in CAPFs: ...